ETH: Bearish Harmonic Pattern Could Push Prices Down
Ethereum (ETH) has recently transformed significantly, making its overall picture very complex.
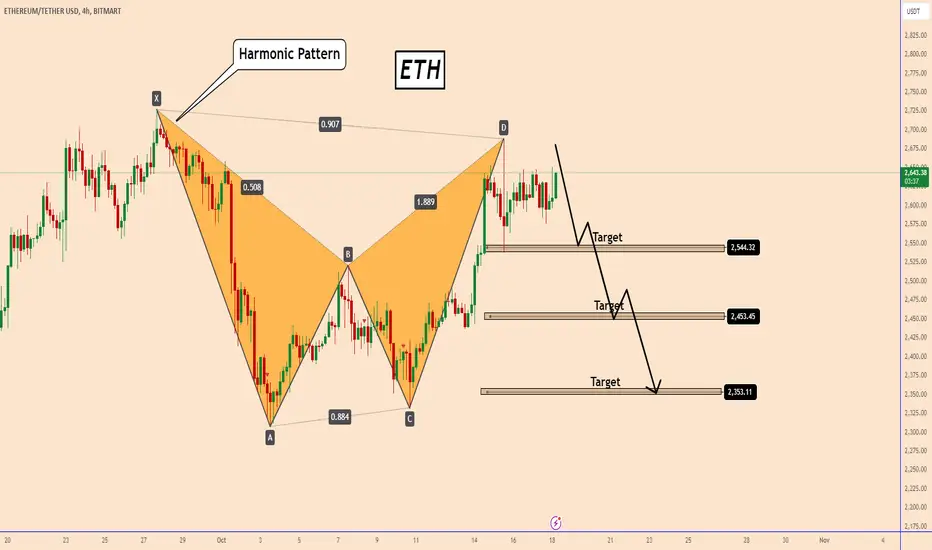
However, on the 60-minute chart, a clear harmonic bearish pattern is emerging.
If this pattern unfolds as expected, it could push ETH prices down to 2544, 2453 and 2353.
As of now, bitcoin is also on the verge of a bigger price reversal and may change direction soon.
You may find more details in the chart!
Thank you and Good Luck!
❤️PS: Please support with a like or comment if you find this analysis useful for your trading day❤️
Ethereum (ETH) has recently transformed significantly, making its overall picture very complex.
However, on the 60-minute chart, a clear harmonic bearish pattern is emerging.
If this pattern unfolds as expected, it could push ETH prices down to 2544, 2453 and 2353.
As of now, bitcoin is also on the verge of a bigger price reversal and may change direction soon.
You may find more details in the chart!
Thank you and Good Luck!
❤️PS: Please support with a like or comment if you find this analysis useful for your trading day❤️
✅MY FREE Signals Channel
t.me/TradingPuzzles
✅Personal Telegram
t.me/KlejdiCuni
✅Suggested News Channel
t.me/ForexNewsNavigator_Official
t.me/TradingPuzzles
✅Personal Telegram
t.me/KlejdiCuni
✅Suggested News Channel
t.me/ForexNewsNavigator_Official
免責事項
これらの情報および投稿は、TradingViewが提供または保証する金融、投資、取引、またはその他の種類のアドバイスや推奨を意図したものではなく、またそのようなものでもありません。詳しくは利用規約をご覧ください。