Hello guys!
Chart Pattern: Head and Shoulders
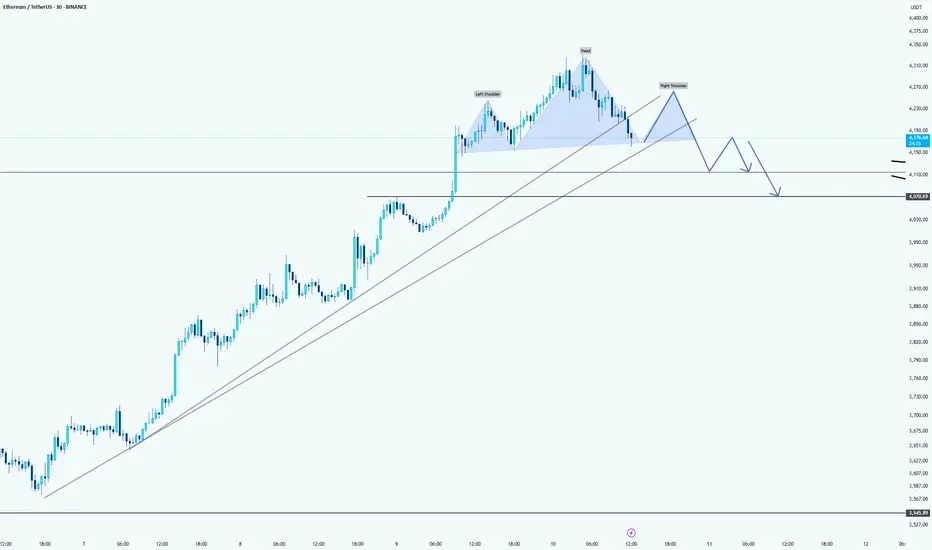
The chart shows a Head and Shoulders pattern forming on the Ethereum price action. The trendline drawn across the neckline of the pattern is a crucial support level to monitor.
Potential Breakdown:
If Ethereum fails to hold above the neckline (around $4,130), we might see a pullback and potentially a breakdown from the pattern. This suggests a bearish outlook for ETH in the short term.
Target:
A possible target for this bearish move could be around the $4,050 - $4,100 range, where the price could find support from the upward trendline (in light gray). The price may retrace towards these levels before deciding whether it will continue higher or confirm further downside.
Uptrend Support:
Ethereum remains in an overall uptrend, as indicated by the sloping upward trendline beneath the price action. If the price pulls back to this trendline and holds, there could still be bullish potential.
Chart Pattern: Head and Shoulders
The chart shows a Head and Shoulders pattern forming on the Ethereum price action. The trendline drawn across the neckline of the pattern is a crucial support level to monitor.
Potential Breakdown:
If Ethereum fails to hold above the neckline (around $4,130), we might see a pullback and potentially a breakdown from the pattern. This suggests a bearish outlook for ETH in the short term.
Target:
A possible target for this bearish move could be around the $4,050 - $4,100 range, where the price could find support from the upward trendline (in light gray). The price may retrace towards these levels before deciding whether it will continue higher or confirm further downside.
Uptrend Support:
Ethereum remains in an overall uptrend, as indicated by the sloping upward trendline beneath the price action. If the price pulls back to this trendline and holds, there could still be bullish potential.
Proud ThinkMarkets Ambassador -> Discover & Grow: bit.ly/Think-Markets
------
My recommended Exchange -> YEX: bit.ly/YEX-M
------
Telegram channel: t.me/melikatrader94
Forex channel: t.me/melikatrader94GoldForex
------
My recommended Exchange -> YEX: bit.ly/YEX-M
------
Telegram channel: t.me/melikatrader94
Forex channel: t.me/melikatrader94GoldForex
免責事項
これらの情報および投稿は、TradingViewが提供または保証する金融、投資、取引、またはその他の種類のアドバイスや推奨を意図したものではなく、またそのようなものでもありません。詳しくは利用規約をご覧ください。