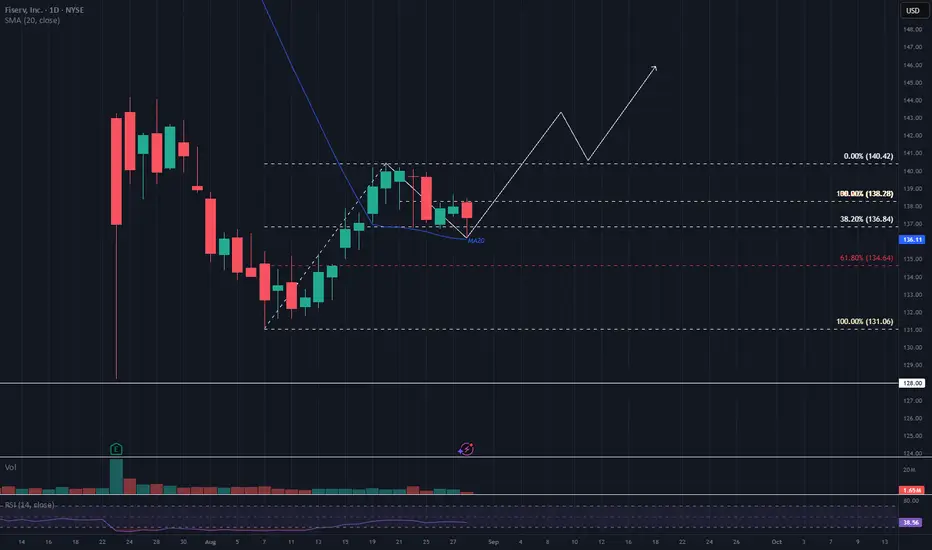
FI is currently moving slowly after a sharp decline triggered by ER. Technically, the stock appears to be well-supported by the MA20 and the 38.2% Fibonacci retracement level.
Despite the sluggish pace, the chart suggests a potential uptrend. In the first phase, I anticipate a move toward the $140 level, with a possible breakout. Following that, the price may seek support around ~$140 before continuing upward toward $145 in the second phase.
This is a technical observation and not a recommendation to buy or sell.
免責事項
これらの情報および投稿は、TradingViewが提供または保証する金融、投資、取引、またはその他の種類のアドバイスや推奨を意図したものではなく、またそのようなものでもありません。詳しくは利用規約をご覧ください。
免責事項
これらの情報および投稿は、TradingViewが提供または保証する金融、投資、取引、またはその他の種類のアドバイスや推奨を意図したものではなく、またそのようなものでもありません。詳しくは利用規約をご覧ください。