Summary
Structure flipped from a lengthy falling channel to a sustained uptrend after a clear breakout.
Post-breakout trend evolved into a parabolic advance with accelerating momentum.
Trend remains bullish but risk of sharp mean‑reversion increases as curvature steepens.
Plan: Buy-the-dip toward dynamic supports with strict risk control; avoid chasing vertical candles.
What the chart shows
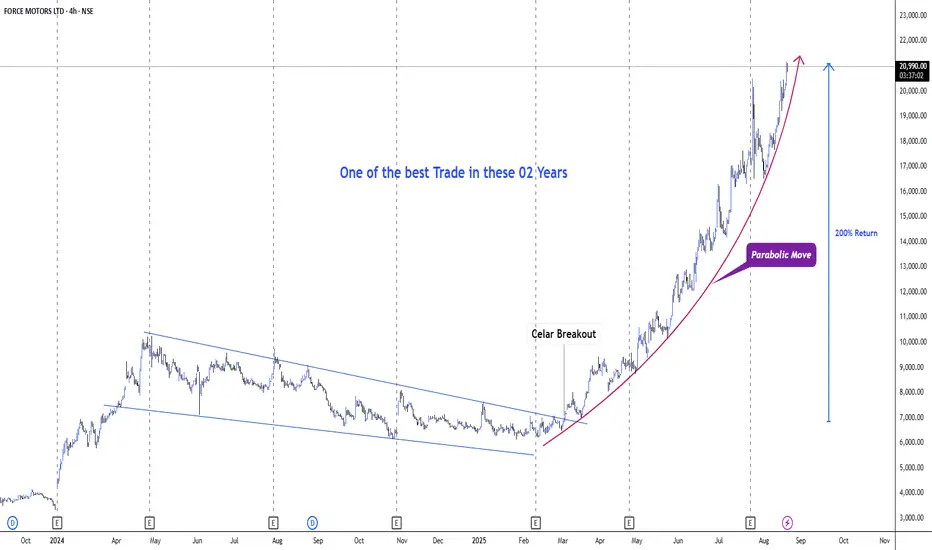
Downtrend phase: A well-defined descending channel persisted for several months into early 2025.
Breakout: Price broke above the channel with expansion in range and follow‑through—textbook “change of character”.
Trend maturation: The advance has transitioned into a parabolic curve with higher highs/lows compressing in time, indicating momentum clustering and potential late‑stage acceleration.
Return magnitude: The move from breakout base to current print approximates a 200% run, per the annotation, consistent with parabolic behavior.
Key Levels (from the image)
Immediate resistance: Area near 20,800–21,000 where price is currently pressing along the parabolic arc.
Rising dynamic support: Parabolic guide curve; secondary support around prior swing clusters roughly 17,000–18,000.
Deeper support/invalidations: Breakout shelf and last higher‑low zone around 13,500–14,500. Loss of this zone would damage the uptrend structure.
Momentum & Risk Read
Strong momentum regime: Tight, shallow pullbacks; frequent small-bodied consolidations followed by quick breakouts—sign of aggressive dip buying.
Parabolic risk: As curvature steepens, the probability of a swift vertical drop to the curve or to the last consolidation increases. Expect 10–20% whips possible without trend break.
Volume/OBV not visible in the image; plan assumes momentum still intact but reactive.
Trading Plan (for TradingView post)
Bias: Bullish, momentum continuation with caution.
Do not chase extended candles at the top of the arc. Prefer pullbacks to structure.
Entries
Pullback-to-curve buy: Stagger bids on a retrace to the parabolic guide or the most recent 4h demand block.
Breakout‑continuation: If price flags below 21,000 and breaks out on expanding 4h range, enter on break with tight risk.
Stops
Tactical stop: Below the most recent 4h swing low that anchors the parabolic curve (keep risk ≤1R of average upswing).
Structural stop: Below 17,000 (loss of mid‑trend shelf) if position trades are taken.
Hard invalidation: Close below 13,500–14,500 zone would signal trend deterioration; reduce exposure materially.
Targets
Near‑term: Trail into strength; take partials on each vertical expansion, re‑add on pullbacks.
Extensions: Use measured‑move logic from last consolidation height; alternatively, trail below prior 4h lows to stay in the parabola.
If a blow‑off top occurs (wide spread up bar followed by immediate reversal), exit 50–100% and wait for base rebuild.
Risk Management
Scale‑in approach: 1/3 on first touch of curve, 1/3 on confirmation (bullish 4h reversal), 1/3 on break of minor flag.
Never average down below structural stop; honor invalidation.
Position sizing should anticipate volatility spikes typical of parabolic phases.
Trade Triggers to Monitor
4h bearish engulfing closing through the curve with follow‑through: caution—expect mean reversion to 17,000–18,000.
Tight 4h pennant under resistance, then high‑range breakout: momentum continuation.
RSI/Momentum divergence on 4h coupled with failure to make new highs: signals cooling; switch to swing‑reversion tactics.
Structure flipped from a lengthy falling channel to a sustained uptrend after a clear breakout.
Post-breakout trend evolved into a parabolic advance with accelerating momentum.
Trend remains bullish but risk of sharp mean‑reversion increases as curvature steepens.
Plan: Buy-the-dip toward dynamic supports with strict risk control; avoid chasing vertical candles.
What the chart shows
Downtrend phase: A well-defined descending channel persisted for several months into early 2025.
Breakout: Price broke above the channel with expansion in range and follow‑through—textbook “change of character”.
Trend maturation: The advance has transitioned into a parabolic curve with higher highs/lows compressing in time, indicating momentum clustering and potential late‑stage acceleration.
Return magnitude: The move from breakout base to current print approximates a 200% run, per the annotation, consistent with parabolic behavior.
Key Levels (from the image)
Immediate resistance: Area near 20,800–21,000 where price is currently pressing along the parabolic arc.
Rising dynamic support: Parabolic guide curve; secondary support around prior swing clusters roughly 17,000–18,000.
Deeper support/invalidations: Breakout shelf and last higher‑low zone around 13,500–14,500. Loss of this zone would damage the uptrend structure.
Momentum & Risk Read
Strong momentum regime: Tight, shallow pullbacks; frequent small-bodied consolidations followed by quick breakouts—sign of aggressive dip buying.
Parabolic risk: As curvature steepens, the probability of a swift vertical drop to the curve or to the last consolidation increases. Expect 10–20% whips possible without trend break.
Volume/OBV not visible in the image; plan assumes momentum still intact but reactive.
Trading Plan (for TradingView post)
Bias: Bullish, momentum continuation with caution.
Do not chase extended candles at the top of the arc. Prefer pullbacks to structure.
Entries
Pullback-to-curve buy: Stagger bids on a retrace to the parabolic guide or the most recent 4h demand block.
Breakout‑continuation: If price flags below 21,000 and breaks out on expanding 4h range, enter on break with tight risk.
Stops
Tactical stop: Below the most recent 4h swing low that anchors the parabolic curve (keep risk ≤1R of average upswing).
Structural stop: Below 17,000 (loss of mid‑trend shelf) if position trades are taken.
Hard invalidation: Close below 13,500–14,500 zone would signal trend deterioration; reduce exposure materially.
Targets
Near‑term: Trail into strength; take partials on each vertical expansion, re‑add on pullbacks.
Extensions: Use measured‑move logic from last consolidation height; alternatively, trail below prior 4h lows to stay in the parabola.
If a blow‑off top occurs (wide spread up bar followed by immediate reversal), exit 50–100% and wait for base rebuild.
Risk Management
Scale‑in approach: 1/3 on first touch of curve, 1/3 on confirmation (bullish 4h reversal), 1/3 on break of minor flag.
Never average down below structural stop; honor invalidation.
Position sizing should anticipate volatility spikes typical of parabolic phases.
Trade Triggers to Monitor
4h bearish engulfing closing through the curve with follow‑through: caution—expect mean reversion to 17,000–18,000.
Tight 4h pennant under resistance, then high‑range breakout: momentum continuation.
RSI/Momentum divergence on 4h coupled with failure to make new highs: signals cooling; switch to swing‑reversion tactics.
関連の投稿
免責事項
この情報および投稿は、TradingViewが提供または推奨する金融、投資、トレード、その他のアドバイスや推奨を意図するものではなく、それらを構成するものでもありません。詳細は利用規約をご覧ください。
関連の投稿
免責事項
この情報および投稿は、TradingViewが提供または推奨する金融、投資、トレード、その他のアドバイスや推奨を意図するものではなく、それらを構成するものでもありません。詳細は利用規約をご覧ください。