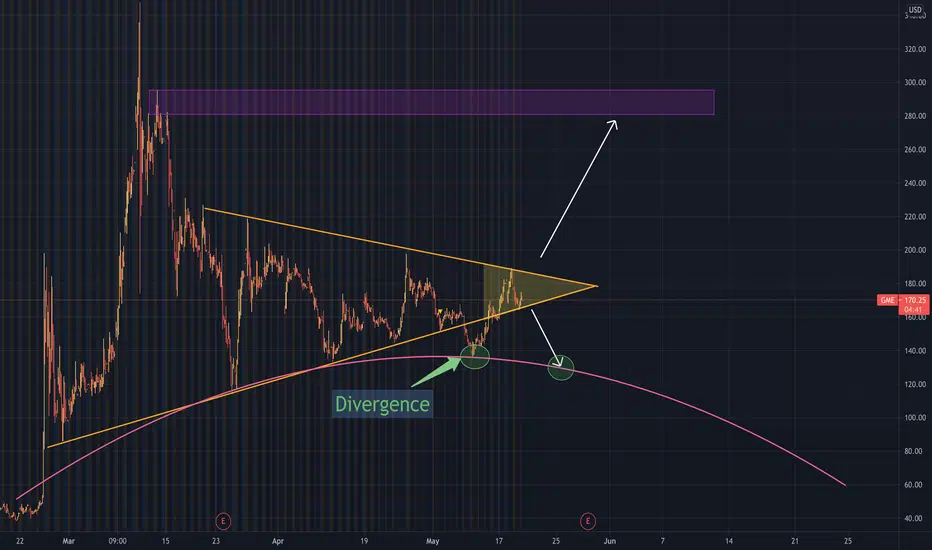
The chart shows tight price consolidation with divergence*. The two arrows indicated possible price targets.
*Divergence is when the asset price moves in the direction opposite to what a technical indicator indicates.
*Divergence is when the asset price moves in the direction opposite to what a technical indicator indicates.
免責事項
これらの情報および投稿は、TradingViewが提供または保証する金融、投資、取引、またはその他の種類のアドバイスや推奨を意図したものではなく、またそのようなものでもありません。詳しくは利用規約をご覧ください。
免責事項
これらの情報および投稿は、TradingViewが提供または保証する金融、投資、取引、またはその他の種類のアドバイスや推奨を意図したものではなく、またそのようなものでもありません。詳しくは利用規約をご覧ください。