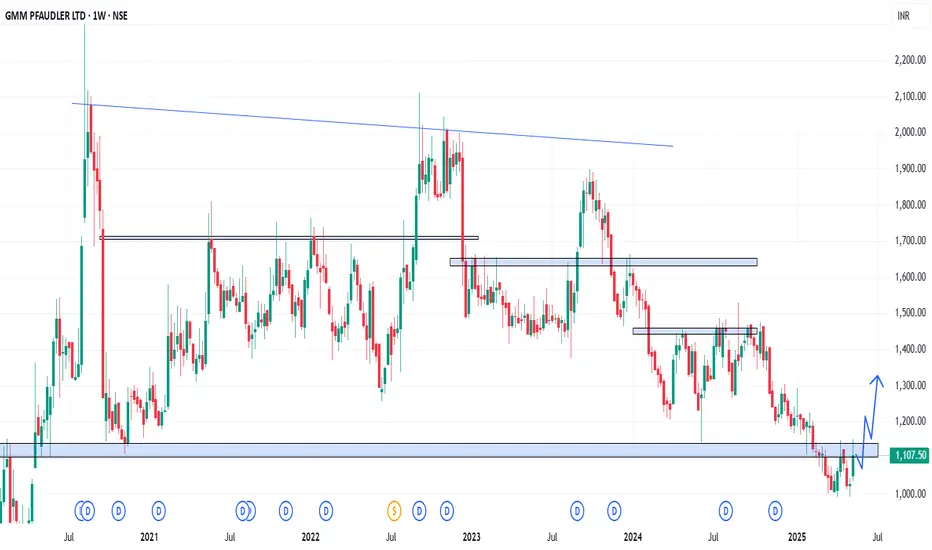
In the Weekly Chart of GMMPFAUDLR ,
we can see that, after strong selling, it is resisting itself.
Let it create a halt candle and then show a strong momentum.
Expected momentum is shown in chart.
we can see that, after strong selling, it is resisting itself.
Let it create a halt candle and then show a strong momentum.
Expected momentum is shown in chart.
免責事項
これらの情報および投稿は、TradingViewが提供または保証する金融、投資、取引、またはその他の種類のアドバイスや推奨を意図したものではなく、またそのようなものでもありません。詳しくは利用規約をご覧ください。
免責事項
これらの情報および投稿は、TradingViewが提供または保証する金融、投資、取引、またはその他の種類のアドバイスや推奨を意図したものではなく、またそのようなものでもありません。詳しくは利用規約をご覧ください。