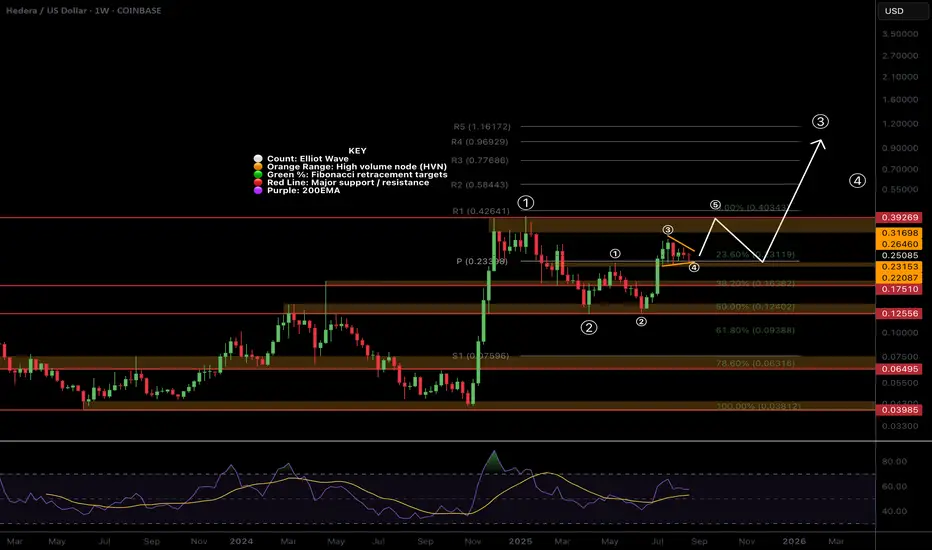
Wave 2 of (3) has a high probability of ending at the wave 4 triangle base which is the weekly pivot and 0.236 Fibonacci retracement adding confluence. This fib level support would indicating continued trend strength.
If it is a wave 1 of (3) is completing then we can expect the long term target to overextend the weekly R5 pivot point of $1.16, possibly reaching $3.
Weekly RSI remains at the EQ so plenty of room to grow.
Analysis is invalidated below the weekly pivot.
Safe trading
PhD Candidate: Investing, Sentiment & Social Mood
MSc Financial Econ
Technical Analyst 7 years
Trader / Investor 14 years
DeTrended Metrics Report (Free): detrended.substack.com
Members Only Trading Signals: tradesignals.substack.com
MSc Financial Econ
Technical Analyst 7 years
Trader / Investor 14 years
DeTrended Metrics Report (Free): detrended.substack.com
Members Only Trading Signals: tradesignals.substack.com
関連の投稿
免責事項
これらの情報および投稿は、TradingViewが提供または保証する金融、投資、取引、またはその他の種類のアドバイスや推奨を意図したものではなく、またそのようなものでもありません。詳しくは利用規約をご覧ください。