This analysis is intended solely for educational purposes and does not constitute financial advice.
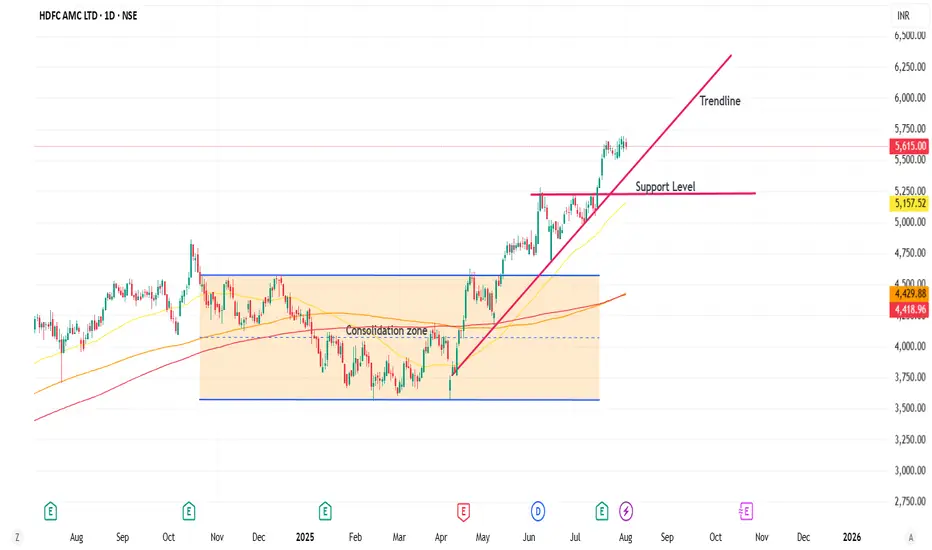
The stock of HDFC Asset Management Company (HDFC AMC) is currently demonstrating a gradual upward trajectory following a breakout from a seven-month consolidation phase. This breakout signals renewed bullish momentum in the stock's price action.
Key technical indicators support this trend:
• ✅ Trading above major moving averages: The stock is positioned above the 200-day, 150-day, and 50-day moving averages, which typically indicates strong underlying support and a positive long-term outlook.
• ✅ Holding above a critical support level: This reinforces the bullish sentiment and reduces the likelihood of a sharp downside reversal in the near term.
Given these technical factors, there is a high probability of continued upward movement. However, it is essential to approach trading with caution. 📌
免責事項
この情報および投稿は、TradingViewが提供または推奨する金融、投資、トレード、その他のアドバイスや推奨を意図するものではなく、それらを構成するものでもありません。詳細は利用規約をご覧ください。
免責事項
この情報および投稿は、TradingViewが提供または推奨する金融、投資、トレード、その他のアドバイスや推奨を意図するものではなく、それらを構成するものでもありません。詳細は利用規約をご覧ください。