Chart Breakdown
1. Price Action & Trend
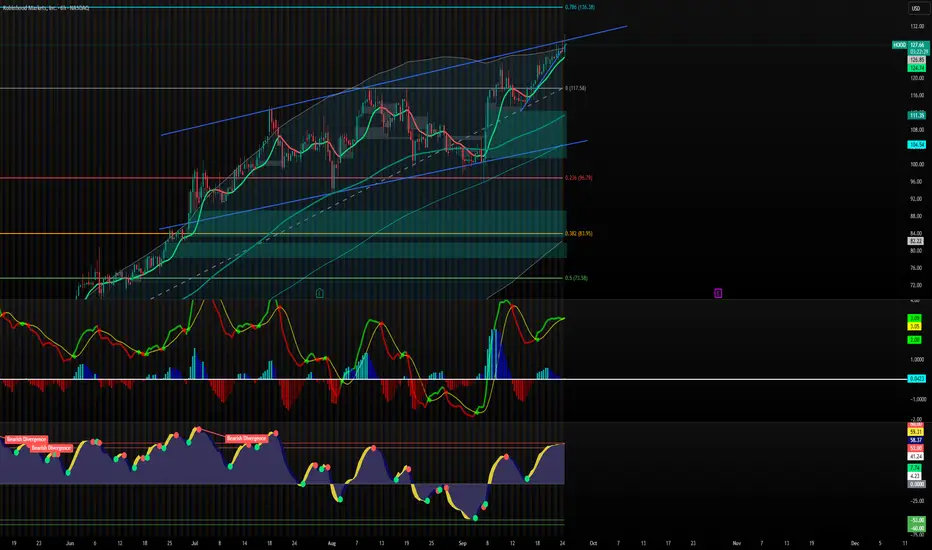
Current price: ~128.19
The stock is moving inside a rising wedge channel (two converging upward blue lines).
Price is testing the upper resistance of the wedge — often a spot where momentum can stall or reverse.
Strong uptrend since late August, but this steep climb may be overextended.
2. Fibonacci Levels
Major retracement levels marked:
0.236 (~96.79) = First key support if price pulls back.
0.382 (~83.95) = Deeper support zone.
0.786 (~136.38) = Next potential target/resistance above.
The price is approaching the 0.786 Fib target at ~136, which could act as a ceiling.
3. Indicators
MACD (middle panel): Positive momentum, but the histogram shows it’s starting to flatten. It could mean slowing momentum.
Oscillator (bottom panel):
Shows previous bearish divergences (price made higher highs, oscillator didn’t).
Currently in the overbought zone.
Signals potential for a pullback soon.
4. Volume / Strength
The recent move up came with strong buying volume (supporting the rally).
But rising wedge patterns usually break downward once buyers are exhausted.
📊 Sentiment & Prediction
Short-Term Sentiment:
🔼 Bullish momentum (trend is still up, targeting ~136).
⚠️ But overbought indicators + wedge resistance suggest caution.
Medium-Term Sentiment:
If HOOD fails to break above 130–136 resistance, a retracement toward 117 support (channel midline) or even 96–100 (Fib 0.236) is possible.
Long-Term Sentiment:
Still overall bullish trend intact unless price breaks below the wedge support (~117 → 96 zone).
✅ Summary:
Bullish but overextended.
Watch for rejection near 130–136 → could trigger a pullback.
Key support levels = 117, 96, 84.
Break above 136 with volume = strong bullish continuation.
1. Price Action & Trend
Current price: ~128.19
The stock is moving inside a rising wedge channel (two converging upward blue lines).
Price is testing the upper resistance of the wedge — often a spot where momentum can stall or reverse.
Strong uptrend since late August, but this steep climb may be overextended.
2. Fibonacci Levels
Major retracement levels marked:
0.236 (~96.79) = First key support if price pulls back.
0.382 (~83.95) = Deeper support zone.
0.786 (~136.38) = Next potential target/resistance above.
The price is approaching the 0.786 Fib target at ~136, which could act as a ceiling.
3. Indicators
MACD (middle panel): Positive momentum, but the histogram shows it’s starting to flatten. It could mean slowing momentum.
Oscillator (bottom panel):
Shows previous bearish divergences (price made higher highs, oscillator didn’t).
Currently in the overbought zone.
Signals potential for a pullback soon.
4. Volume / Strength
The recent move up came with strong buying volume (supporting the rally).
But rising wedge patterns usually break downward once buyers are exhausted.
📊 Sentiment & Prediction
Short-Term Sentiment:
🔼 Bullish momentum (trend is still up, targeting ~136).
⚠️ But overbought indicators + wedge resistance suggest caution.
Medium-Term Sentiment:
If HOOD fails to break above 130–136 resistance, a retracement toward 117 support (channel midline) or even 96–100 (Fib 0.236) is possible.
Long-Term Sentiment:
Still overall bullish trend intact unless price breaks below the wedge support (~117 → 96 zone).
✅ Summary:
Bullish but overextended.
Watch for rejection near 130–136 → could trigger a pullback.
Key support levels = 117, 96, 84.
Break above 136 with volume = strong bullish continuation.
免責事項
これらの情報および投稿は、TradingViewが提供または保証する金融、投資、取引、またはその他の種類のアドバイスや推奨を意図したものではなく、またそのようなものでもありません。詳しくは利用規約をご覧ください。
免責事項
これらの情報および投稿は、TradingViewが提供または保証する金融、投資、取引、またはその他の種類のアドバイスや推奨を意図したものではなく、またそのようなものでもありません。詳しくは利用規約をご覧ください。