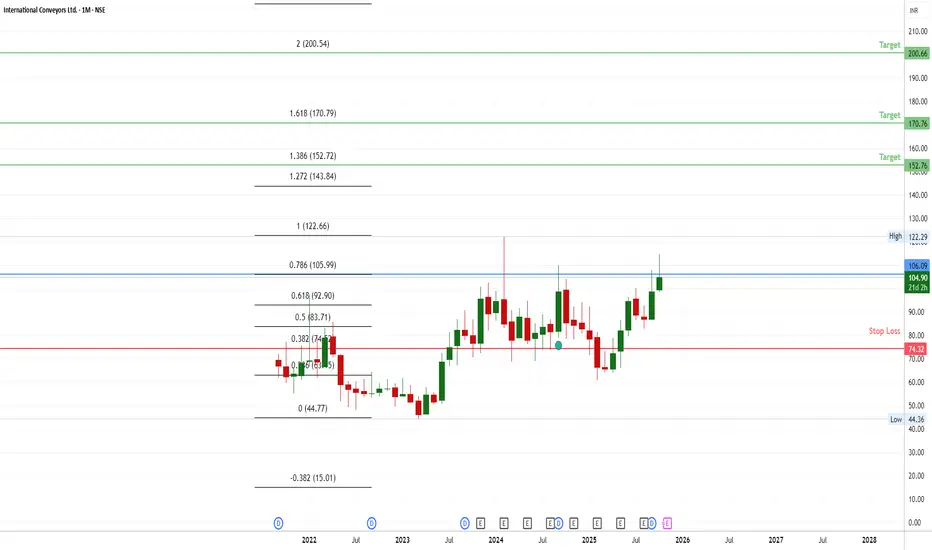
📌 Current Level: 105 (0.786 Fibonacci)
The market is hovering near this critical resistance level. A break above could signal bullish momentum.
📌 Upside Targets: 150 / 170 / 200
If the level of 105 is breached, these are the key retracement levels where price may find resistance next.
📌 Stop Loss: 74 (0.382 Fibonacci)
If the market reverses and falls below this level, it indicates a potential bearish move, making this a safe exit point.
免責事項
この情報および投稿は、TradingViewが提供または推奨する金融、投資、トレード、その他のアドバイスや推奨を意図するものではなく、それらを構成するものでもありません。詳細は利用規約をご覧ください。
免責事項
この情報および投稿は、TradingViewが提供または推奨する金融、投資、トレード、その他のアドバイスや推奨を意図するものではなく、それらを構成するものでもありません。詳細は利用規約をご覧ください。