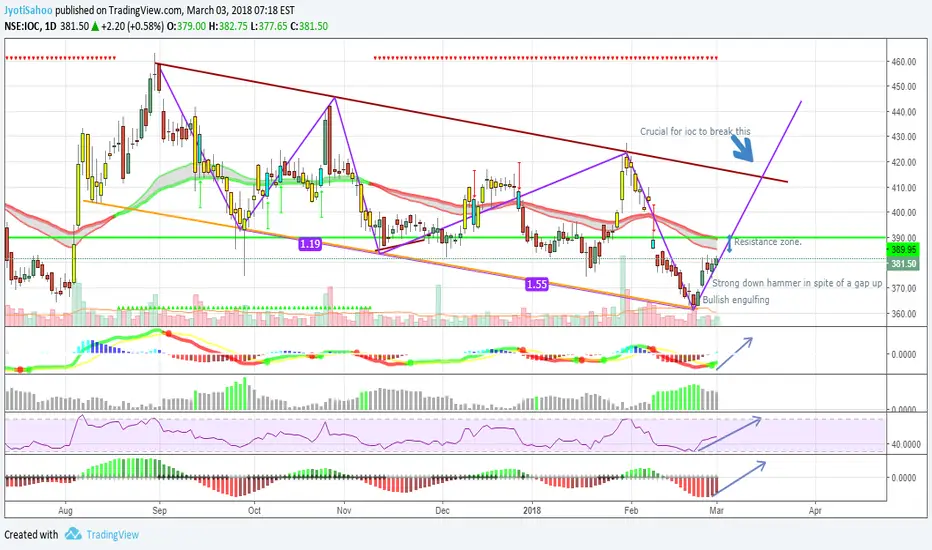
IOC on a daily chart is following a down channel .lower lows are being formed. and lower highs. this is a false recovery probably upto 414 . oscillators and tech indicators are in favor . this can be cashed in. the last 5 candles are pretty strong. but if we see a channel break out that will be a big bonus.
There is resistance zone around 390. if the stock sees to hold that level and volumes pick up . we can see upmove.
There is resistance zone around 390. if the stock sees to hold that level and volumes pick up . we can see upmove.
トレード稼働中
ノート
20 points profit. closing just above 400 was a very good sign.免責事項
この情報および投稿は、TradingViewが提供または推奨する金融、投資、トレード、その他のアドバイスや推奨を意図するものではなく、それらを構成するものでもありません。詳細は利用規約をご覧ください。
免責事項
この情報および投稿は、TradingViewが提供または推奨する金融、投資、トレード、その他のアドバイスや推奨を意図するものではなく、それらを構成するものでもありません。詳細は利用規約をご覧ください。