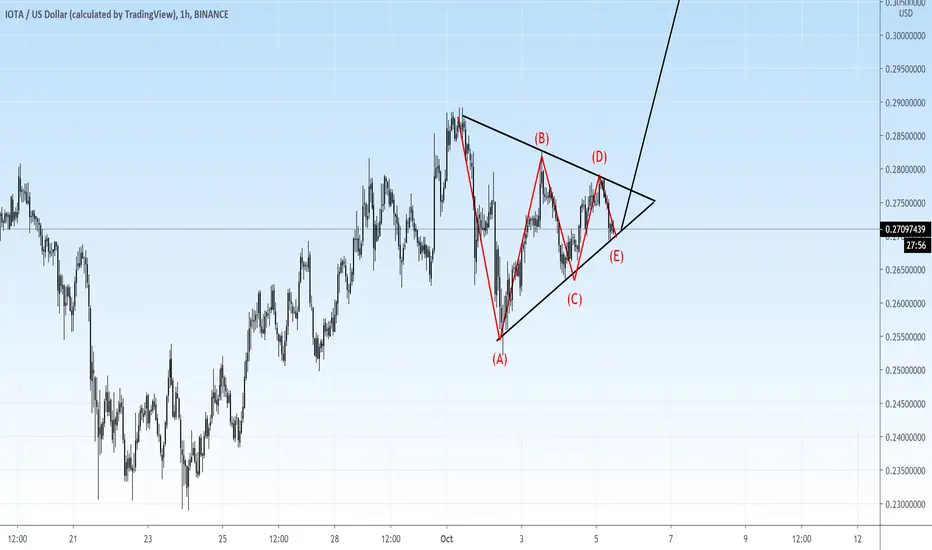
Chart shows possible corrective triangle in bullish trend.
The price touched the E point from which the price should rise. If this does not happen then the pattern is failed.
The price touched the E point from which the price should rise. If this does not happen then the pattern is failed.
注文をキャンセル
免責事項
これらの情報および投稿は、TradingViewが提供または保証する金融、投資、取引、またはその他の種類のアドバイスや推奨を意図したものではなく、またそのようなものでもありません。詳しくは利用規約をご覧ください。
免責事項
これらの情報および投稿は、TradingViewが提供または保証する金融、投資、取引、またはその他の種類のアドバイスや推奨を意図したものではなく、またそのようなものでもありません。詳しくは利用規約をご覧ください。