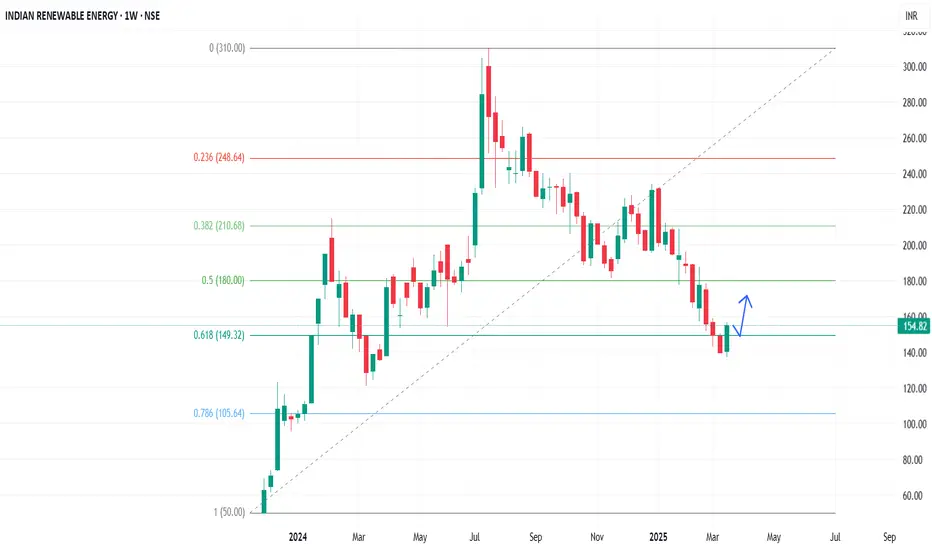
In the Weekly Chart of IREDA ,
we can see that; it a given a comeback from last FIBO level of support after crossing it.
Let it create a Halt candle and take support of FIBO level and then we can see the continuity in momentum.
we can see that; it a given a comeback from last FIBO level of support after crossing it.
Let it create a Halt candle and take support of FIBO level and then we can see the continuity in momentum.
免責事項
この情報および投稿は、TradingViewが提供または推奨する金融、投資、トレード、その他のアドバイスや推奨を意図するものではなく、それらを構成するものでもありません。詳細は利用規約をご覧ください。
免責事項
この情報および投稿は、TradingViewが提供または推奨する金融、投資、トレード、その他のアドバイスや推奨を意図するものではなく、それらを構成するものでもありません。詳細は利用規約をご覧ください。