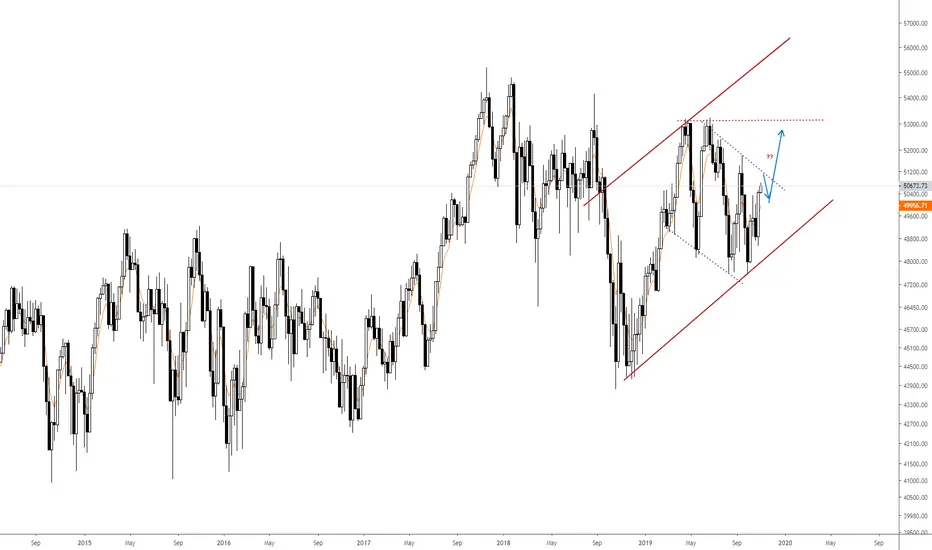
The weekly J200 top 40 index chart is still trading in a shorter term down trend channel that began during may 2019 up until now.
However the bigger uptrend is still intact from the lows of October 2018 And I would suspect that if we get a strong weekly close above 51500 it should open up room to move to 53200
However the bigger uptrend is still intact from the lows of October 2018 And I would suspect that if we get a strong weekly close above 51500 it should open up room to move to 53200
免責事項
これらの情報および投稿は、TradingViewが提供または保証する金融、投資、取引、またはその他の種類のアドバイスや推奨を意図したものではなく、またそのようなものでもありません。詳しくは利用規約をご覧ください。
免責事項
これらの情報および投稿は、TradingViewが提供または保証する金融、投資、取引、またはその他の種類のアドバイスや推奨を意図したものではなく、またそのようなものでもありません。詳しくは利用規約をご覧ください。