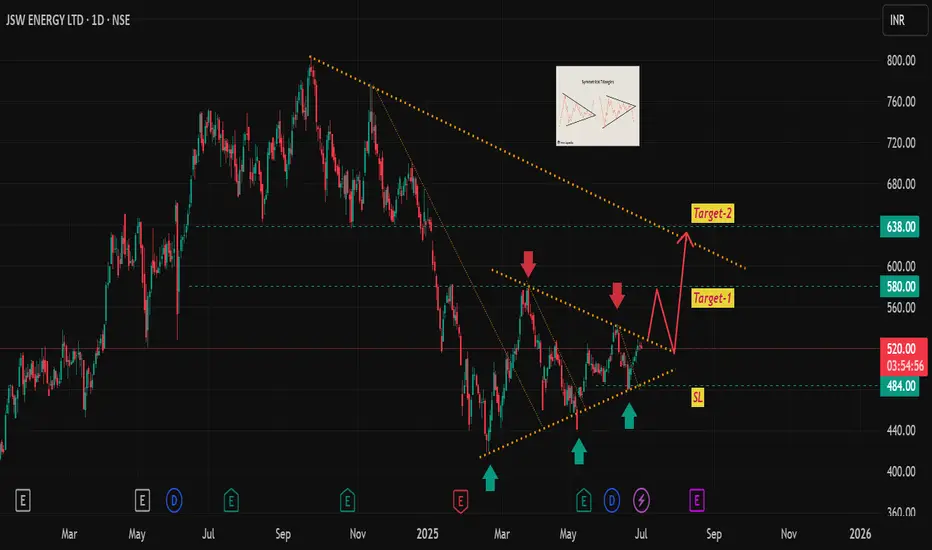
JSW Energy - under the formation of symmetric triangle chart pattern, it is near to breakout level, one can go long (short term) here, stop loss and targets are mentioned in the chart.
Please note: I am not a certified stock analyst, this chart is purely for education purpose, request you to do your own financial assessment before investment/trade.
Please note: I am not a certified stock analyst, this chart is purely for education purpose, request you to do your own financial assessment before investment/trade.
免責事項
これらの情報および投稿は、TradingViewが提供または保証する金融、投資、取引、またはその他の種類のアドバイスや推奨を意図したものではなく、またそのようなものでもありません。詳しくは利用規約をご覧ください。
免責事項
これらの情報および投稿は、TradingViewが提供または保証する金融、投資、取引、またはその他の種類のアドバイスや推奨を意図したものではなく、またそのようなものでもありません。詳しくは利用規約をご覧ください。