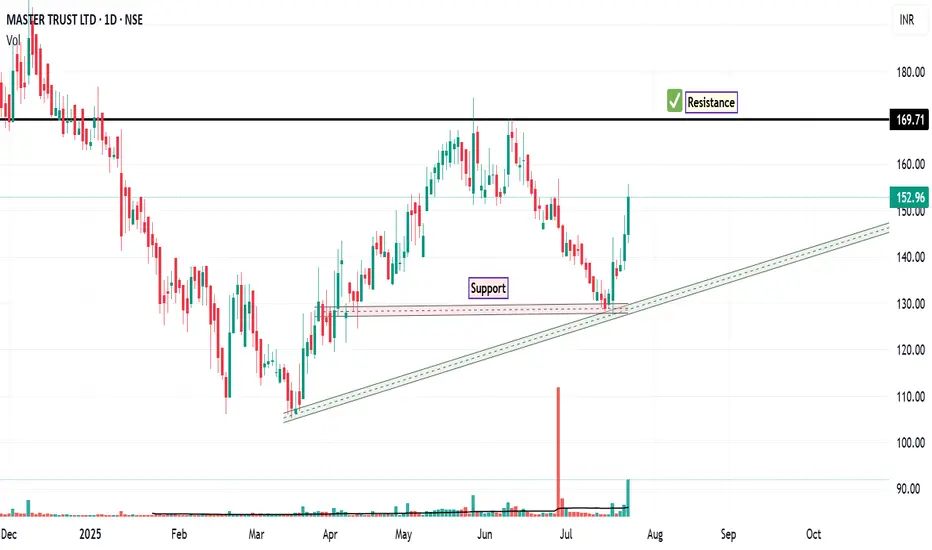
The chart of MASTERTR appears to be approaching a critical juncture, marked on the chart. These levels are essential for assessing the current balance between supply and demand.
1. The Support Level (Marked on Chart)
This level 129 represents a zone of historical demand where buying interest has previously emerged to halt price declines. It acts as a structural floor for the recent price action.
Outlook: As long as the price remains above this support zone, the technical structure can be viewed as neutral to constructive. A decisive breach below this level, particularly on increased volume, would suggest a breakdown in structure and could indicate a potential continuation of bearish momentum.
2. The Resistance Level (Marked on Chart)
This level of 169 represents a more formidable area of overhead supply, likely corresponding to a previous significant peak or a major distribution zone. It is the first major target and potential obstacle following a successful breakout.
Disclaimer:
The information provided in this technical analysis is for informational and educational purposes only and should not be construed as financial or investment advice. It is an interpretation of historical price data. Market dynamics can change, and past performance is not indicative of future results. All trading and investment activities involve risk. Always conduct your own thorough due diligence and consult with a qualified financial advisor before making any investment decisions.
トレード終了: 利益確定目標に到達
Target reached, Trade Closed免責事項
この情報および投稿は、TradingViewが提供または推奨する金融、投資、トレード、その他のアドバイスや推奨を意図するものではなく、それらを構成するものでもありません。詳細は利用規約をご覧ください。
免責事項
この情報および投稿は、TradingViewが提供または推奨する金融、投資、トレード、その他のアドバイスや推奨を意図するものではなく、それらを構成するものでもありません。詳細は利用規約をご覧ください。