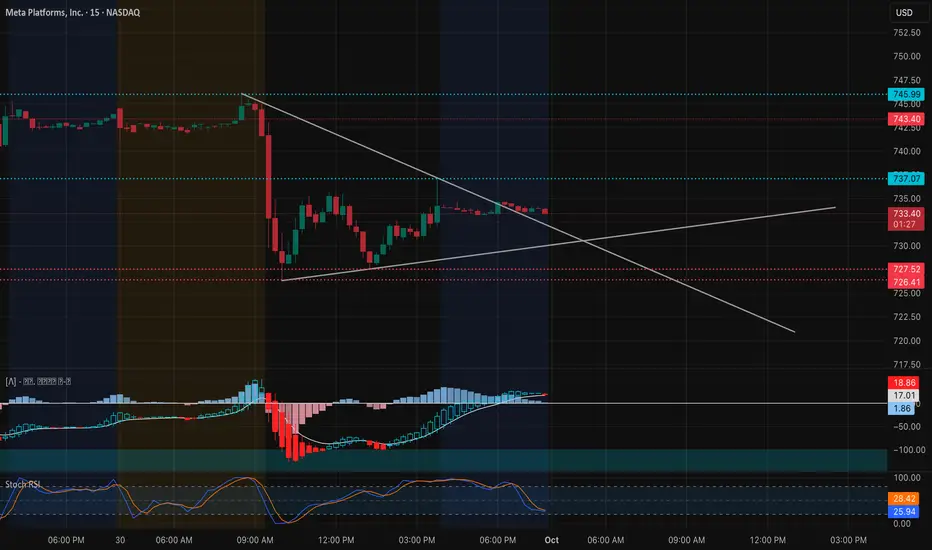
Intraday View (15-Min Chart)
META dropped sharply early and has since consolidated around $733 inside a tightening wedge. Sellers remain active, but support is holding near $727–$730 for now.
* Support Levels: $733.00, $727.52, $726.41
* Resistance Levels: $737.07, $743.40, $745.99
* Indicators: MACD still red but flattening out, showing momentum cooling. Stoch RSI near oversold, hinting at a potential relief bounce.
📌 Intraday Thought (Oct. 1): If $733 holds, META could rebound toward $737–$745. A breakdown under $727 risks a drop toward $720. Scalpers can lean long on $733 support with stops tight, or fade into $743–$745 if price rejects.
Options & Swing View (1H + GEX)
 \
\
Gamma exposure shows where the flows matter:
* Upside: Large call walls stacked at $745–$755, with extension toward $760–$770.
* Downside: Strong put support anchored at $727–$720, deeper protection at $715.
This keeps META boxed between $727–$745 short term. A breakout over $745 could fuel a run toward $755–$760, while losing $727 risks accelerating downside toward $720 or even $715.
* Bullish Play (Oct. 1): Calls or spreads targeting $755–$760 if $745 breaks with volume.
* Bearish Hedge: Puts toward $727 → $720 if support gives way.
* Neutral Play: Iron condor between $727–$745 to capture premium in range.
My Thoughts (Oct. 1)
META is in a decision zone with $733 holding as a pivot. The chart shows compression under the wedge trendline—if $745 is reclaimed, momentum opens quickly to the upside. But losing $727 would signal continuation of weakness. I’d stay patient and let price confirm at either $745 breakout or $727 breakdown.
Disclaimer: This analysis is for educational purposes only and does not constitute financial advice. Always do your own research and manage risk before trading.
META dropped sharply early and has since consolidated around $733 inside a tightening wedge. Sellers remain active, but support is holding near $727–$730 for now.
* Support Levels: $733.00, $727.52, $726.41
* Resistance Levels: $737.07, $743.40, $745.99
* Indicators: MACD still red but flattening out, showing momentum cooling. Stoch RSI near oversold, hinting at a potential relief bounce.
📌 Intraday Thought (Oct. 1): If $733 holds, META could rebound toward $737–$745. A breakdown under $727 risks a drop toward $720. Scalpers can lean long on $733 support with stops tight, or fade into $743–$745 if price rejects.
Options & Swing View (1H + GEX)
Gamma exposure shows where the flows matter:
* Upside: Large call walls stacked at $745–$755, with extension toward $760–$770.
* Downside: Strong put support anchored at $727–$720, deeper protection at $715.
This keeps META boxed between $727–$745 short term. A breakout over $745 could fuel a run toward $755–$760, while losing $727 risks accelerating downside toward $720 or even $715.
* Bullish Play (Oct. 1): Calls or spreads targeting $755–$760 if $745 breaks with volume.
* Bearish Hedge: Puts toward $727 → $720 if support gives way.
* Neutral Play: Iron condor between $727–$745 to capture premium in range.
My Thoughts (Oct. 1)
META is in a decision zone with $733 holding as a pivot. The chart shows compression under the wedge trendline—if $745 is reclaimed, momentum opens quickly to the upside. But losing $727 would signal continuation of weakness. I’d stay patient and let price confirm at either $745 breakout or $727 breakdown.
Disclaimer: This analysis is for educational purposes only and does not constitute financial advice. Always do your own research and manage risk before trading.
免責事項
この情報および投稿は、TradingViewが提供または推奨する金融、投資、トレード、その他のアドバイスや推奨を意図するものではなく、それらを構成するものでもありません。詳細は利用規約をご覧ください。
免責事項
この情報および投稿は、TradingViewが提供または推奨する金融、投資、トレード、その他のアドバイスや推奨を意図するものではなく、それらを構成するものでもありません。詳細は利用規約をご覧ください。