Broader Market Structure
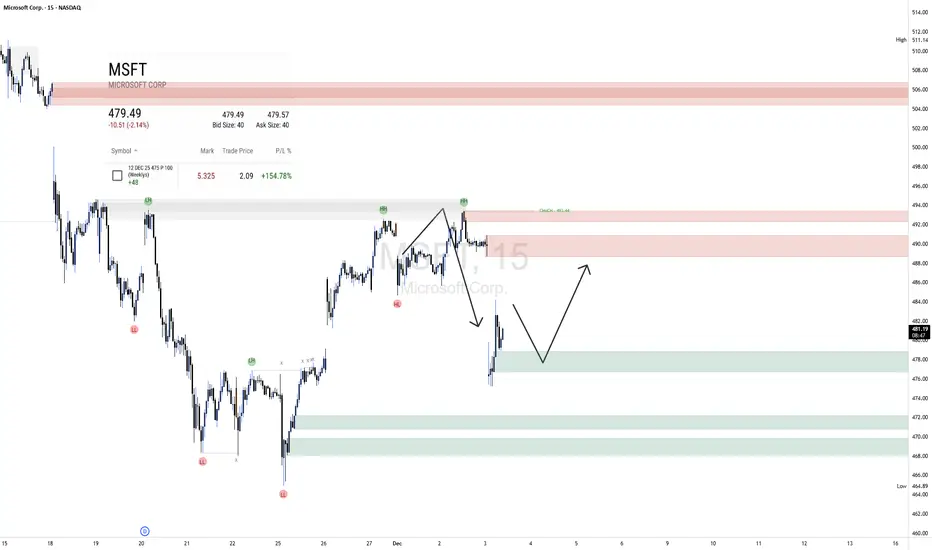
MSFT on the 15-minute chart is in a short-term uptrend following a sequence of higher lows and higher highs from the $464 area. The key structural shift occurred when price printed a CHoCH at $492.44, breaking above the previous swing high and confirming bullish intent. Before that, the market had transitioned from lower lows into a clear higher-low structure, signaling accumulation before expansion. The recent drop from the $492–$494 supply is corrective, not impulsive, which suggests we’re seeing a pullback rather than a reversal unless demand fails.
Supply & Demand Zones
The upper supply around $492–$494 has shown clear weakness for buyers; price rejected immediately with strong momentum and multiple wicks showing absorption and aggressive selling. Higher up, the major supply at $504–$507 remains a strong distribution zone where price previously dropped sharply, indicating institutional control. On the demand side, the closest zone at $478–$475 is fresh and unmitigated; buyers stepped in with strength from that area earlier, producing a decisive rally and ultimately the CHoCH. A deeper demand below $470–$466 is even more important because it initiated the entire trend shift and contains protected lows.
Price Action in the Marked Region
Price is currently declining from supply and pushing toward the green demand region. The move down is controlled rather than impulsive, indicating sell-side momentum is fading as it approaches prior buyer interest. The marked projection makes sense: a dip into $478–$475 would allow liquidity collection before a bounce toward the $488–$492 supply above. If demand holds, expect responsive buying with a clean bullish engulfing candle or long-wick rejection.
Trade Bias, Direction & Invalidation
The bias for now is bullish, looking for a pullback to demand and continuation upward. The expected direction is a retest of $478–$475 followed by a rally toward $488–$492.
A key invalidation level is a clean 15-minute close below $475—if that level breaks, sellers likely target the deeper $470–$466 demand, and the bullish thesis weakens significantly.
Momentum & Candle Behavior
Momentum currently favors sellers in the short term, but the drop is stepping rather than impulsive, suggesting exhaustion into demand. Look for a shift in candle behavior—such as a bullish engulfing bar, absorption wick, or displacement candle—to confirm buyer strength returning.
Looking for powerful AI trading signals? Visit ProSignal.ai and take your trading to the next level! or join our telegram channel at t.me/prosignalai
Discord: discord.gg/qQmChQYG
Discord: discord.gg/qQmChQYG
免責事項
この情報および投稿は、TradingViewが提供または推奨する金融、投資、トレード、その他のアドバイスや推奨を意図するものではなく、それらを構成するものでもありません。詳細は利用規約をご覧ください。