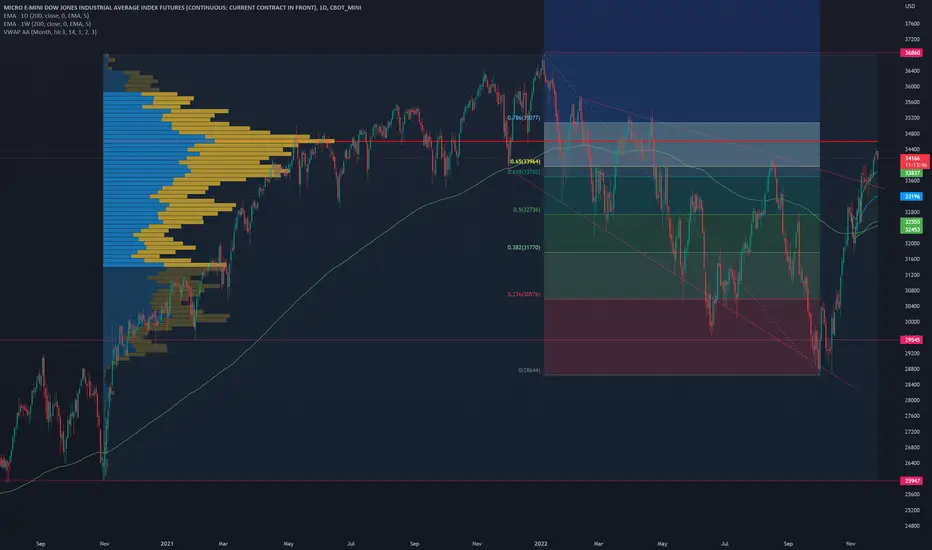
One of the best preforming parts of the stock market in recent weeks has been the Dow Jones Industrial average. On this mini futures chart I can see that this could be the time where we see a serious pull back because there is a high volume zone right above where we are now.
免責事項
この情報および投稿は、TradingViewが提供または推奨する金融、投資、トレード、その他のアドバイスや推奨を意図するものではなく、それらを構成するものでもありません。詳細は利用規約をご覧ください。
免責事項
この情報および投稿は、TradingViewが提供または推奨する金融、投資、トレード、その他のアドバイスや推奨を意図するものではなく、それらを構成するものでもありません。詳細は利用規約をご覧ください。