🚀 NAS100 NASDAQ-100 INDEX | Master Technical Analysis | Weekly Forecast Nov 3-7, 2025 🚀
📈 MULTI-TIMEFRAME ANALYSIS | INTRADAY & SWING TRADING BLUEPRINT | 25,866.9 📈
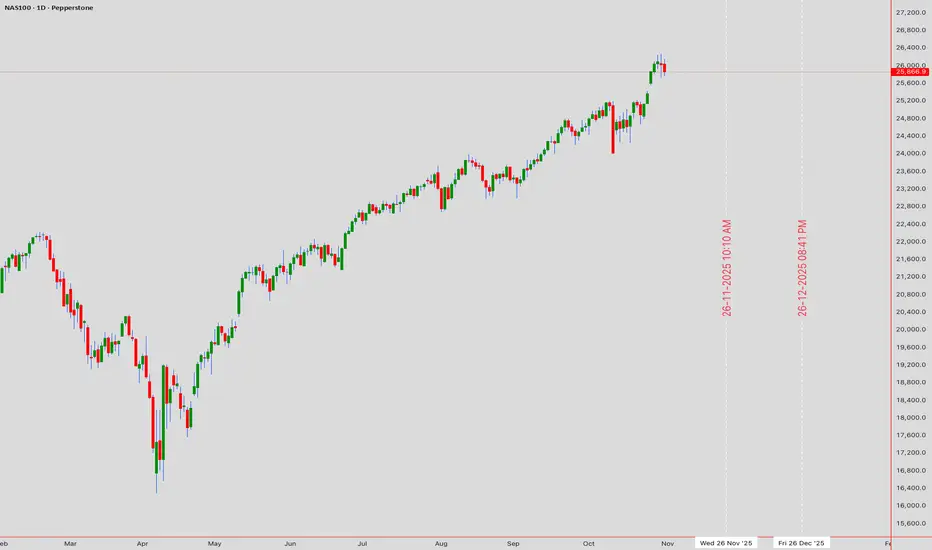
Closing Level: 25,866.9 | Analysis Date: November 1, 2025 | UTC+4
════════════════════════════════════════════════════════════════
🎯 MARKET OVERVIEW & CRITICAL LEVELS
NASDAQ-100 consolidates near all-time high territory at 25,866.9, presenting a pivotal moment for tech bulls. Our comprehensive multi-timeframe analysis reveals a cautiously bullish stance with immediate resistance at 25,900 and crucial support at 25,750. The upcoming week offers exceptional opportunities for both scalpers and position traders as we navigate post-earnings volatility.
Major Support Levels: 📉
Key Resistance Zones: 📈
════════════════════════════════════════════════════════════════
📊 WEEKLY TIMEFRAME (1W) - THE BIG PICTURE
Elliott Wave Structure: 🌊
Currently navigating Wave 4 correction within larger degree Wave 5. The shallow retracement suggests strength, targeting 26,500+ upon completion. Alternate count places us in Wave B of an ABC correction - monitor 25,500 for validation.
Wyckoff Analysis: 📖
Textbook Re-accumulation Trading Range (TR) after upthrust. Volume signature confirms Phase C - Last Point of Support (LPS). Expect markup phase initiation above 25,920.
Ichimoku Cloud Perspective: ☁️
Price maintains position above weekly Kumo with Chikou Span confirmation. Tenkan-sen at 25,720 provides dynamic support. Bullish TK cross intact since October.
Harmonic Pattern Alert: 🦋
Potential Bullish Crab pattern forming with PRZ at 25,650-25,700. The 1.618 XA extension at 26,450 serves as measured target upon pattern completion.
Gann Analysis: 📐
Price respecting 1x1 Gann angle from September low. Next significant Gann resistance at 26,080 (45-degree angle from yearly pivot).
════════════════════════════════════════════════════════════════
📉 DAILY TIMEFRAME (1D) - SWING TRADER'S ROADMAP
Japanese Candlestick Patterns: 🕯️
Yesterday's Spinning Top at resistance signals indecision. Watch for today's close above 25,900 to confirm Three White Soldiers continuation pattern.
Pattern Recognition:
Ascending Triangle formation with horizontal resistance at 25,900. Successful breakout projects 26,250 target (350-point measured move).
Bollinger Bands Analysis:
Price kissing upper band (25,885) with bands expanding - volatility breakout imminent. Middle band at 25,720 serves as dynamic support.
RSI & Momentum Oscillators:
RSI at 62 - bullish but not overbought. Hidden bullish divergence on 4H timeframe supports continuation thesis.
Volume Profile: 📊
High Volume Node (HVN) at 25,750-25,800 acting as support magnet. Point of Control (POC) at 25,680 defines major support.
════════════════════════════════════════════════════════════════
⏰ 4-HOUR TIMEFRAME (4H) - SWING & INTRADAY FUSION
Dow Theory Application: 📈
Primary trend: Bullish (series of HH-HL intact)
Secondary trend: Consolidation phase
Minor trend: Testing resistance
Chart Pattern Alert:
Bull Flag completion targeting 26,050. Flag pole: 25,600-25,900 (300 points). Breakout confirmation above 25,920 activates pattern.
Moving Average Configuration:
Pine Script®
VWAP Analysis:
Weekly VWAP at 25,810 acting as dynamic pivot. Price above VWAP = bullish intraday bias.
════════════════════════════════════════════════════════════════
🎪 1-HOUR TIMEFRAME (1H) - PRECISION ENTRIES
Immediate Setup: 💡
Inverse Head & Shoulders pattern developing. Left shoulder: 25,750, Head: 25,700, Right shoulder forming at 25,760. Neckline at 25,900 - breakout targets 26,100.
Support & Resistance Matrix:
Entry Strategies: 🎯
════════════════════════════════════════════════════════════════
⚡ 30-MINUTE TIMEFRAME (30M) - SCALPER'S PLAYGROUND
Micro Structure: 🔍
Rising Wedge pattern - bearish implications short-term. Expect pullback to 25,800 before continuation. Volume declining confirms pattern.
Scalping Zones: 🎯
ATR & Volatility:
30M ATR(14): 35 points - optimal stop-loss range: 25-30 points
════════════════════════════════════════════════════════════════
🏃 15-MINUTE & 5-MINUTE ULTRA-SCALPING
15-Minute Momentum Setup: ⚠️
Bullish Pennant forming - breakout above 25,880 targets 25,920 (40-point quick move).
5-Minute Precision Matrix:
RSI Scalping Strategy:
Pine Script®
════════════════════════════════════════════════════════════════
📅 WEEKLY FORECAST & DAILY GAMEPLAN (Nov 3-7, 2025)
Monday, November 3: 🚀
Gap-up potential to 25,920. First test of resistance.
Strategy: Wait for pullback to 25,850 for longs
Target: 25,950-25,980
Tuesday, November 4: 📊
Election uncertainty - expect 100+ point range.
Strategy: Fade extremes with tight stops
Range: 25,750-25,950
Wednesday, November 5: 💥
Breakout day - major move expected post-election.
Strategy: Momentum trades only
Breakout target: 26,100+
Thursday, November 6: 🔄
Consolidation/profit-taking day.
Strategy: Range trading 25,900-26,050
Focus: Mean reversion
Friday, November 7: 📈
Weekly options expiry - pin risk around 26,000.
Strategy: Fade moves away from 26,000
Close above 26,000 = Bullish weekly
════════════════════════════════════════════════════════════════
💼 COMPREHENSIVE TRADE MANAGEMENT
Intraday Risk Parameters: 🎮
Swing Position Guidelines: 📊
════════════════════════════════════════════════════════════════
⚠️ RISK SCENARIOS & INVALIDATION TRIGGERS
Bearish Reversal Signals: 🐻
Black Swan Considerations: 🦢
• Tech earnings surprises
• Federal Reserve policy shifts
• Geopolitical tensions escalation
• Major tech regulatory news
• AI sector rotation risks
════════════════════════════════════════════════════════════════
🔥 HIGH-PROBABILITY CONFLUENCE ZONES
Ultimate Buy Zone: ✅
25,750-25,800
(EMA cluster + Fibonacci 61.8% + Volume POC + Daily pivot)
Ultimate Sell Zone: ❌
26,050-26,100
(Pattern targets + Weekly R1 + Psychological round number)
Breakout Trigger Zone: 🚀
25,920-25,950
(Multiple pattern completions + Resistance cluster)
════════════════════════════════════════════════════════════════
📝 WEEK AHEAD SUMMARY & ACTION ITEMS
The NASDAQ-100 stands at a critical technical juncture at 25,866.9. Multiple timeframe analysis confirms bullish bias above 25,750 with significant upside potential toward 26,300. The convergence of pattern completions, moving average support, and favorable volume dynamics creates an optimal risk-reward environment for disciplined traders.
Top 3 Trade Setups: 🏆
Key Success Factors:
• Respect stop-losses religiously
• Scale in positions gradually
• Book partial profits at targets
• Trail stops on winners
• Stay patient for A+ setups
════════════════════════════════════════════════════════════════
🎯 FINAL THOUGHTS
Tech bulls maintain control above 25,750. The path of least resistance remains HIGHER targeting 26,300. Election week volatility presents exceptional opportunities for prepared traders. Remember: Plan your trade, trade your plan!
Stay disciplined. Stay profitable. 💰
════════════════════════════════════════════════════════════════
#NAS100 #NASDAQ #TechnicalAnalysis #Trading #Indices #StockMarket #DayTrading #SwingTrading #ElliottWave #PriceAction #TradingStrategy #TradingView #MarketAnalysis #IndexTrading #TechStocks #SPX #QQQ #MarketForecast
🔔 Follow for Daily Premium Analysis! | Trade Smart, Not Hard! 📊
Risk Disclaimer: This analysis is for educational purposes only. Past performance doesn't guarantee future results. Always conduct your own research and implement proper risk management.
📈 MULTI-TIMEFRAME ANALYSIS | INTRADAY & SWING TRADING BLUEPRINT | 25,866.9 📈
Closing Level: 25,866.9 | Analysis Date: November 1, 2025 | UTC+4
════════════════════════════════════════════════════════════════
🎯 MARKET OVERVIEW & CRITICAL LEVELS
NASDAQ-100 consolidates near all-time high territory at 25,866.9, presenting a pivotal moment for tech bulls. Our comprehensive multi-timeframe analysis reveals a cautiously bullish stance with immediate resistance at 25,900 and crucial support at 25,750. The upcoming week offers exceptional opportunities for both scalpers and position traders as we navigate post-earnings volatility.
Major Support Levels: 📉
- Immediate: 25,800 - 25,820
- Secondary: 25,750 - 25,770
- Critical: 25,650 - 25,680
- Major: 25,500 - 25,550
Key Resistance Zones: 📈
- Immediate: 25,900 - 25,920
- Secondary: 25,980 - 26,000
- Psychological: 26,100 - 26,150
- Major Target: 26,250 - 26,300
════════════════════════════════════════════════════════════════
📊 WEEKLY TIMEFRAME (1W) - THE BIG PICTURE
Elliott Wave Structure: 🌊
Currently navigating Wave 4 correction within larger degree Wave 5. The shallow retracement suggests strength, targeting 26,500+ upon completion. Alternate count places us in Wave B of an ABC correction - monitor 25,500 for validation.
Wyckoff Analysis: 📖
Textbook Re-accumulation Trading Range (TR) after upthrust. Volume signature confirms Phase C - Last Point of Support (LPS). Expect markup phase initiation above 25,920.
Ichimoku Cloud Perspective: ☁️
Price maintains position above weekly Kumo with Chikou Span confirmation. Tenkan-sen at 25,720 provides dynamic support. Bullish TK cross intact since October.
Harmonic Pattern Alert: 🦋
Potential Bullish Crab pattern forming with PRZ at 25,650-25,700. The 1.618 XA extension at 26,450 serves as measured target upon pattern completion.
Gann Analysis: 📐
Price respecting 1x1 Gann angle from September low. Next significant Gann resistance at 26,080 (45-degree angle from yearly pivot).
════════════════════════════════════════════════════════════════
📉 DAILY TIMEFRAME (1D) - SWING TRADER'S ROADMAP
Japanese Candlestick Patterns: 🕯️
Yesterday's Spinning Top at resistance signals indecision. Watch for today's close above 25,900 to confirm Three White Soldiers continuation pattern.
Pattern Recognition:
Ascending Triangle formation with horizontal resistance at 25,900. Successful breakout projects 26,250 target (350-point measured move).
Bollinger Bands Analysis:
Price kissing upper band (25,885) with bands expanding - volatility breakout imminent. Middle band at 25,720 serves as dynamic support.
RSI & Momentum Oscillators:
RSI at 62 - bullish but not overbought. Hidden bullish divergence on 4H timeframe supports continuation thesis.
Volume Profile: 📊
High Volume Node (HVN) at 25,750-25,800 acting as support magnet. Point of Control (POC) at 25,680 defines major support.
════════════════════════════════════════════════════════════════
⏰ 4-HOUR TIMEFRAME (4H) - SWING & INTRADAY FUSION
Dow Theory Application: 📈
Primary trend: Bullish (series of HH-HL intact)
Secondary trend: Consolidation phase
Minor trend: Testing resistance
Chart Pattern Alert:
Bull Flag completion targeting 26,050. Flag pole: 25,600-25,900 (300 points). Breakout confirmation above 25,920 activates pattern.
Moving Average Configuration:
EMA 20: 25,825 (immediate support)
EMA 50: 25,760 (strong support)
SMA 100: 25,680 (critical support)
SMA 200: 25,550 (major support)
VWAP Analysis:
Weekly VWAP at 25,810 acting as dynamic pivot. Price above VWAP = bullish intraday bias.
════════════════════════════════════════════════════════════════
🎪 1-HOUR TIMEFRAME (1H) - PRECISION ENTRIES
Immediate Setup: 💡
Inverse Head & Shoulders pattern developing. Left shoulder: 25,750, Head: 25,700, Right shoulder forming at 25,760. Neckline at 25,900 - breakout targets 26,100.
Support & Resistance Matrix:
- R4: 26,150 (Weekly R2 Pivot)
- R3: 26,050 (Pattern Target)
- R2: 25,980 (Psychological)
- R1: 25,920 (Neckline)
- PIVOT: 25,866 (Current)
- S1: 25,820 (1H Support)
- S2: 25,760 (Right Shoulder)
- S3: 25,700 (Pattern Low)
Entry Strategies: 🎯
- Breakout Long: Above 25,920 | Stop: 25,850 | Target: 26,050
- Pullback Long: 25,820 test | Stop: 25,760 | Target: 25,920
- Reversal Long: 25,760 bounce | Stop: 25,700 | Target: 25,900
════════════════════════════════════════════════════════════════
⚡ 30-MINUTE TIMEFRAME (30M) - SCALPER'S PLAYGROUND
Micro Structure: 🔍
Rising Wedge pattern - bearish implications short-term. Expect pullback to 25,800 before continuation. Volume declining confirms pattern.
Scalping Zones: 🎯
Prime Buy Zones:
• Zone A: 25,820-25,830 (30M demand)
• Zone B: 25,790-25,800 (VWAP test)
• Zone C: 25,760-25,770 (Strong support)
Prime Sell Zones:
• Zone A: 25,900-25,910 (30M supply)
• Zone B: 25,940-25,950 (Extension)
• Zone C: 25,980-26,000 (Major resistance)
ATR & Volatility:
30M ATR(14): 35 points - optimal stop-loss range: 25-30 points
════════════════════════════════════════════════════════════════
🏃 15-MINUTE & 5-MINUTE ULTRA-SCALPING
15-Minute Momentum Setup: ⚠️
Bullish Pennant forming - breakout above 25,880 targets 25,920 (40-point quick move).
5-Minute Precision Matrix:
- London Open: Range 25,840-25,880
- NY Pre-market: Breakout potential above 25,900
- NY Open: Volatility spike - 50+ point moves
- NY Afternoon: Consolidation 25,850-25,900
RSI Scalping Strategy:
5M RSI < 25: Oversold bounce long
5M RSI > 75: Overbought short
15M RSI divergence: Position entry
Optimal RSI range: 40-60 for trends
════════════════════════════════════════════════════════════════
📅 WEEKLY FORECAST & DAILY GAMEPLAN (Nov 3-7, 2025)
Monday, November 3: 🚀
Gap-up potential to 25,920. First test of resistance.
Strategy: Wait for pullback to 25,850 for longs
Target: 25,950-25,980
Tuesday, November 4: 📊
Election uncertainty - expect 100+ point range.
Strategy: Fade extremes with tight stops
Range: 25,750-25,950
Wednesday, November 5: 💥
Breakout day - major move expected post-election.
Strategy: Momentum trades only
Breakout target: 26,100+
Thursday, November 6: 🔄
Consolidation/profit-taking day.
Strategy: Range trading 25,900-26,050
Focus: Mean reversion
Friday, November 7: 📈
Weekly options expiry - pin risk around 26,000.
Strategy: Fade moves away from 26,000
Close above 26,000 = Bullish weekly
════════════════════════════════════════════════════════════════
💼 COMPREHENSIVE TRADE MANAGEMENT
Intraday Risk Parameters: 🎮
- Maximum risk per trade: 0.5-1% of capital
- Risk-Reward minimum: 1:2.5 ratio
- Daily stop loss: -2% of account
- Trailing stop activation: After +30 points
- Breakeven stop: After +20 points profit
- Maximum daily trades: 3-5 quality setups
Swing Position Guidelines: 📊
- Position sizing: 2-3% portfolio risk
- Initial stop-loss: Below 25,650 (major support)
- Target 1: 26,050 (30% exit)
- Target 2: 26,150 (40% exit)
- Target 3: 26,300 (20% exit)
- Runner: 26,500 (10% moon shot)
════════════════════════════════════════════════════════════════
⚠️ RISK SCENARIOS & INVALIDATION TRIGGERS
Bearish Reversal Signals: 🐻
- Hourly close below 25,800 = Caution mode
- Daily close below 25,750 = Bearish shift
- Break of 25,650 = Major support failure
- Weekly close below 25,500 = Trend reversal
Black Swan Considerations: 🦢
• Tech earnings surprises
• Federal Reserve policy shifts
• Geopolitical tensions escalation
• Major tech regulatory news
• AI sector rotation risks
════════════════════════════════════════════════════════════════
🔥 HIGH-PROBABILITY CONFLUENCE ZONES
Ultimate Buy Zone: ✅
25,750-25,800
(EMA cluster + Fibonacci 61.8% + Volume POC + Daily pivot)
Ultimate Sell Zone: ❌
26,050-26,100
(Pattern targets + Weekly R1 + Psychological round number)
Breakout Trigger Zone: 🚀
25,920-25,950
(Multiple pattern completions + Resistance cluster)
════════════════════════════════════════════════════════════════
📝 WEEK AHEAD SUMMARY & ACTION ITEMS
The NASDAQ-100 stands at a critical technical juncture at 25,866.9. Multiple timeframe analysis confirms bullish bias above 25,750 with significant upside potential toward 26,300. The convergence of pattern completions, moving average support, and favorable volume dynamics creates an optimal risk-reward environment for disciplined traders.
Top 3 Trade Setups: 🏆
- Swing Long: 25,750-25,800 zone | Target: 26,150
- Breakout Long: Above 25,920 | Target: 26,050
- Scalp Long: VWAP touches at 25,810 | Target: 25,900
Key Success Factors:
• Respect stop-losses religiously
• Scale in positions gradually
• Book partial profits at targets
• Trail stops on winners
• Stay patient for A+ setups
"The trend is your friend until the end when it bends" - Trade the trend, manage the risk!
════════════════════════════════════════════════════════════════
🎯 FINAL THOUGHTS
Tech bulls maintain control above 25,750. The path of least resistance remains HIGHER targeting 26,300. Election week volatility presents exceptional opportunities for prepared traders. Remember: Plan your trade, trade your plan!
Stay disciplined. Stay profitable. 💰
════════════════════════════════════════════════════════════════
#NAS100 #NASDAQ #TechnicalAnalysis #Trading #Indices #StockMarket #DayTrading #SwingTrading #ElliottWave #PriceAction #TradingStrategy #TradingView #MarketAnalysis #IndexTrading #TechStocks #SPX #QQQ #MarketForecast
🔔 Follow for Daily Premium Analysis! | Trade Smart, Not Hard! 📊
Risk Disclaimer: This analysis is for educational purposes only. Past performance doesn't guarantee future results. Always conduct your own research and implement proper risk management.
I am nothing @shunya.trade
免責事項
これらの情報および投稿は、TradingViewが提供または保証する金融、投資、取引、またはその他の種類のアドバイスや推奨を意図したものではなく、またそのようなものでもありません。詳しくは利用規約をご覧ください。
I am nothing @shunya.trade
免責事項
これらの情報および投稿は、TradingViewが提供または保証する金融、投資、取引、またはその他の種類のアドバイスや推奨を意図したものではなく、またそのようなものでもありません。詳しくは利用規約をご覧ください。