Natural Gas Futures – 15min Chart Trading Logic
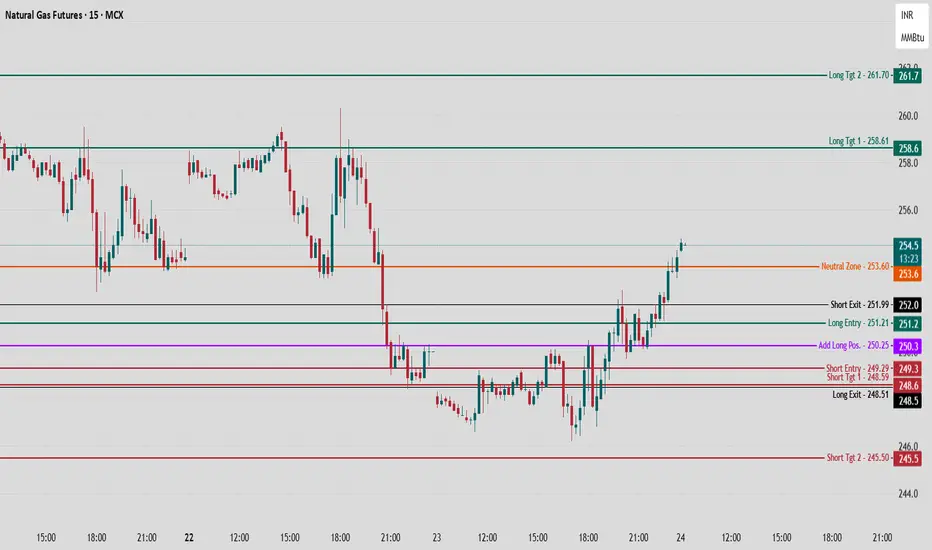
Natural Gas is trading at 254.6, showing a strong upward move after reclaiming key support levels, with momentum building above the short-term base.
Long Trade Logic
Long Entry (251.2):
The long trade triggers above 251.2 as previous consolidation resistance broke, confirming new bullish momentum.
Pyramiding/additional long positions can be considered above 250.3 to ride trend continuation, using recent swing lows as risk anchor.
Upside Targets (258.6 / 261.7):
Target 1 (258.6): This is the first major supply zone where profit-taking could emerge.
Target 2 (261.7): Final mapped target, corresponding to upper range extremes and previous resistance.
Stop Logic:
Stops should be placed below 250.3 for any fresh long, as break below this invalidates bullish structure and exposes to downside risk.
Short Trade Logic
Short Entry (249.3):
The short setup only activates with a breakdown below 249.3, which will likely trigger stop hunts and reversal trades.
Short Targets (248.6 / 245.5):
Target 1 (248.6): First support seen from secondary bounce areas.
Target 2 (245.5): Deeper flush where sellers may aggressively cover.
Short Exit:
Exit shorts above 252, as reclaiming this band suggests failed breakdown and fresh buying.
Neutral and Structure
Neutral Zone (253.6):
Sideways bias; avoid new positions unless a clean break above or below is seen.
Structural View:
Sustained action above 253.6 signals control by bulls, while slip below 251.2 may bring short-term reversal.
Follow Chart Pathik for more such analysis!
Years of disciplined charting in Indices, Commodities & Crypto.
Web: superprofile.bio/chartpathik
Join Free Telegrams for updates.
NSE & MCX: t.me/ChartPathik
US & Crypto: t.me/chartpathikglobal
WhatsApp: +91-99293-91467
Web: superprofile.bio/chartpathik
Join Free Telegrams for updates.
NSE & MCX: t.me/ChartPathik
US & Crypto: t.me/chartpathikglobal
WhatsApp: +91-99293-91467
免責事項
この情報および投稿は、TradingViewが提供または推奨する金融、投資、トレード、その他のアドバイスや推奨を意図するものではなく、それらを構成するものでもありません。詳細は利用規約をご覧ください。