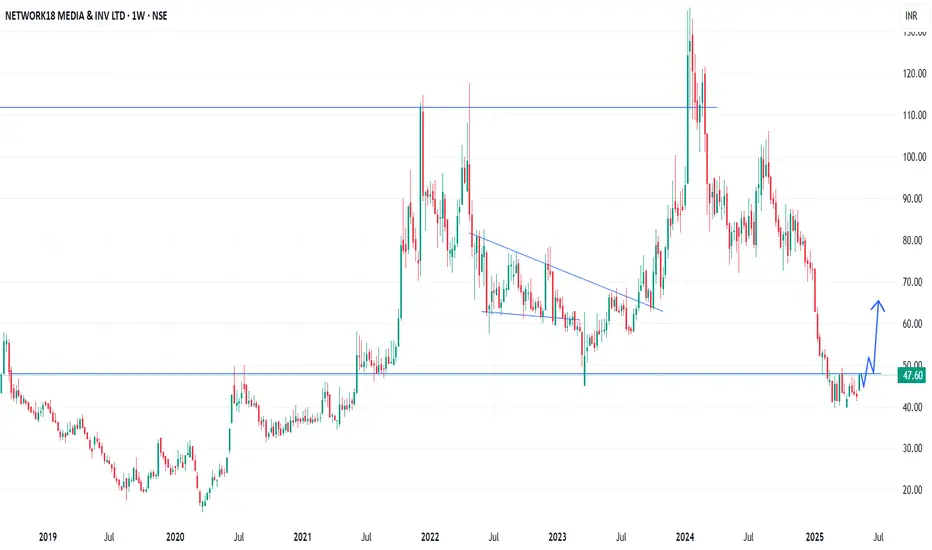
In the Weekly Chart of NETWORK18 ,
we can see that; it is trying to recover from very bottom with W Shape recovery.
Let it create one or two Halt candles to get more strong momentum.
Expected momentum is shown in chart.
we can see that; it is trying to recover from very bottom with W Shape recovery.
Let it create one or two Halt candles to get more strong momentum.
Expected momentum is shown in chart.
免責事項
この情報および投稿は、TradingViewが提供または推奨する金融、投資、トレード、その他のアドバイスや推奨を意図するものではなく、それらを構成するものでもありません。詳細は利用規約をご覧ください。
免責事項
この情報および投稿は、TradingViewが提供または推奨する金融、投資、トレード、その他のアドバイスや推奨を意図するものではなく、それらを構成するものでもありません。詳細は利用規約をご覧ください。