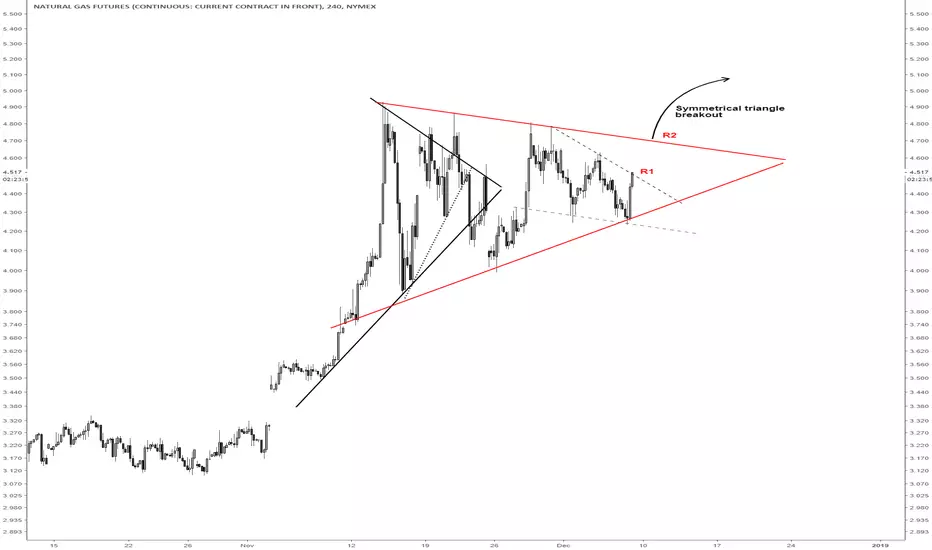
This is a big one, I want this chart in my history. Giant flag/symmetrical triangle.
Warmer Dec than expected and we break down hard! But this is a bullish pattern and continues upwards. Lots of ways to play it, might be wise to just wait for a resolution/breakout first instead of front running.
Warmer Dec than expected and we break down hard! But this is a bullish pattern and continues upwards. Lots of ways to play it, might be wise to just wait for a resolution/breakout first instead of front running.
ノート
UpdateOversold on lower bollinger bands on most time frames up to 12 hr but of course NG can move strongly.
ノート
Updated to include the bull flag spotted by Flapjacks28ノート
Price outside hourly upper bollinger band, price will continue until it finishes its pullback retest to pennant resistance breakdown. Short heavy on the red circle but be diligent about stops.免責事項
この情報および投稿は、TradingViewが提供または推奨する金融、投資、トレード、その他のアドバイスや推奨を意図するものではなく、それらを構成するものでもありません。詳細は利用規約をご覧ください。
免責事項
この情報および投稿は、TradingViewが提供または推奨する金融、投資、トレード、その他のアドバイスや推奨を意図するものではなく、それらを構成するものでもありません。詳細は利用規約をご覧ください。