Based on the charts and the market's performance on Wednesday, October 15, the Nifty experienced a strong rebound, successfully defending a crucial support level and confirming a resumption of the short-term bullish trend.
Detailed Market Structure Breakdown
4-Hour Chart (Macro Trend)
Structure: The Nifty is firmly back in a bullish recovery phase. The price successfully defended the lower boundary of the steep ascending channel and the 25,050 support zone. The strong bullish candle on the 4H chart confirms that the correction seen on Monday/Tuesday was shallow and quickly bought up, reinforcing the overall uptrend.
Key Levels:
Major Supply (Resistance): 25,350 - 25,400. This area is the immediate overhead hurdle, aligning with the recent swing high. A decisive breakout here is needed to challenge the September high of 25,450.
Major Demand (Support): 25,050 - 25,150. This area, which includes the lower boundary of the ascending channel and the 9-period EMA, is the must-hold zone for the continuation of the rally.
Outlook: The short-term bias is strongly bullish. The market is poised to challenge the 25,400 resistance and attempt to test higher levels.
1-Hour Chart (Intermediate View)
Structure: The 1H chart shows a clear Market Structure Shift (MSS) back to the upside. The price broke the immediate swing high after defending the 25,050 level. The index closed strongly within its ascending channel.
Key Levels:
Immediate Resistance: 25,400.
Immediate Support: 25,250 (Recent consolidation zone and Order Block).
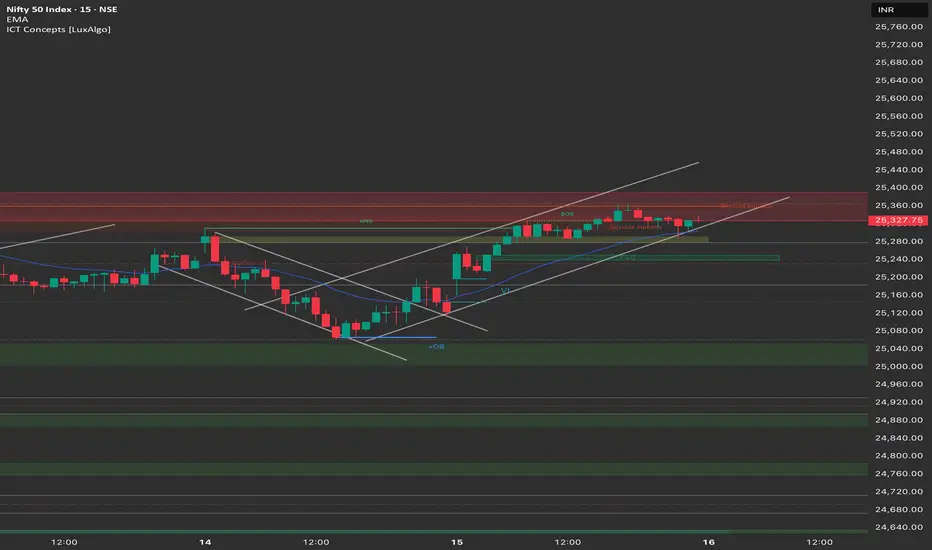
15-Minute Chart (Intraday View)
Structure: The 15M chart confirms the strong bullish momentum. The market closed with a small BOS on the upside, setting up for a bullish opening. The strong close suggests momentum is favorable for continuation. The price is trading within a bullish flag pattern.
Key Levels:
Intraday Supply: 25,400.
Intraday Demand: 25,250.
Outlook: Strongly Bullish.
📈 Trade Plan (Thursday, 16th October)
Market Outlook: The Nifty has shown strong resilience and has resumed its short-term rally. The focus is on a move toward the 25,400 resistance. Infosys, LTIMindtree, and Wipro Q2 results are due today, which will heavily influence the market.
Bullish Scenario (Primary Plan)
Justification: The confirmed bullish reversal, the recapture of key moving averages, and the sustained ascent in the ascending channel favor continuation.
Entry: Long entry on a decisive break and 15-minute candle close above 25,400. Alternatively, look for a dip entry near 25,250 (the immediate consolidation support).
Stop Loss (SL): Place a stop loss below 25,180 (below the recent swing low/FVG).
Targets:
T1: 25,450 (Previous swing high/upper channel).
T2: 25,550 - 25,600 (Next major target zone).
Bearish Scenario (Counter-Trend Plan)
Justification: Only valid if IT earnings disappoint heavily, leading to a breakdown of the short-term bullish structure.
Trigger: A decisive break and 1-hour candle close below 25,000.
Entry: Short entry below 25,000.
Stop Loss (SL): Above 25,150.
Targets:
T1: 24,900 (Major FVG support).
T2: 24,800 (Next support base).
Key Levels for Observation:
Immediate Decision Point: 25,250 - 25,400 zone.
Bullish Confirmation: A break and sustained move above 25,400.
Bearish Warning: A move below 25,180 suggests the bounce is failing.
Major Event: Infosys, LTIMindtree, Wipro Q2 Results. Volatility in IT stocks will be key.
Line in the Sand: 25,000. Below this level, the short-term bullish bias is nullified.
Detailed Market Structure Breakdown
4-Hour Chart (Macro Trend)
Structure: The Nifty is firmly back in a bullish recovery phase. The price successfully defended the lower boundary of the steep ascending channel and the 25,050 support zone. The strong bullish candle on the 4H chart confirms that the correction seen on Monday/Tuesday was shallow and quickly bought up, reinforcing the overall uptrend.
Key Levels:
Major Supply (Resistance): 25,350 - 25,400. This area is the immediate overhead hurdle, aligning with the recent swing high. A decisive breakout here is needed to challenge the September high of 25,450.
Major Demand (Support): 25,050 - 25,150. This area, which includes the lower boundary of the ascending channel and the 9-period EMA, is the must-hold zone for the continuation of the rally.
Outlook: The short-term bias is strongly bullish. The market is poised to challenge the 25,400 resistance and attempt to test higher levels.
1-Hour Chart (Intermediate View)
Structure: The 1H chart shows a clear Market Structure Shift (MSS) back to the upside. The price broke the immediate swing high after defending the 25,050 level. The index closed strongly within its ascending channel.
Key Levels:
Immediate Resistance: 25,400.
Immediate Support: 25,250 (Recent consolidation zone and Order Block).
15-Minute Chart (Intraday View)
Structure: The 15M chart confirms the strong bullish momentum. The market closed with a small BOS on the upside, setting up for a bullish opening. The strong close suggests momentum is favorable for continuation. The price is trading within a bullish flag pattern.
Key Levels:
Intraday Supply: 25,400.
Intraday Demand: 25,250.
Outlook: Strongly Bullish.
📈 Trade Plan (Thursday, 16th October)
Market Outlook: The Nifty has shown strong resilience and has resumed its short-term rally. The focus is on a move toward the 25,400 resistance. Infosys, LTIMindtree, and Wipro Q2 results are due today, which will heavily influence the market.
Bullish Scenario (Primary Plan)
Justification: The confirmed bullish reversal, the recapture of key moving averages, and the sustained ascent in the ascending channel favor continuation.
Entry: Long entry on a decisive break and 15-minute candle close above 25,400. Alternatively, look for a dip entry near 25,250 (the immediate consolidation support).
Stop Loss (SL): Place a stop loss below 25,180 (below the recent swing low/FVG).
Targets:
T1: 25,450 (Previous swing high/upper channel).
T2: 25,550 - 25,600 (Next major target zone).
Bearish Scenario (Counter-Trend Plan)
Justification: Only valid if IT earnings disappoint heavily, leading to a breakdown of the short-term bullish structure.
Trigger: A decisive break and 1-hour candle close below 25,000.
Entry: Short entry below 25,000.
Stop Loss (SL): Above 25,150.
Targets:
T1: 24,900 (Major FVG support).
T2: 24,800 (Next support base).
Key Levels for Observation:
Immediate Decision Point: 25,250 - 25,400 zone.
Bullish Confirmation: A break and sustained move above 25,400.
Bearish Warning: A move below 25,180 suggests the bounce is failing.
Major Event: Infosys, LTIMindtree, Wipro Q2 Results. Volatility in IT stocks will be key.
Line in the Sand: 25,000. Below this level, the short-term bullish bias is nullified.
免責事項
この情報および投稿は、TradingViewが提供または推奨する金融、投資、トレード、その他のアドバイスや推奨を意図するものではなく、それらを構成するものでもありません。詳細は利用規約をご覧ください。
免責事項
この情報および投稿は、TradingViewが提供または推奨する金融、投資、トレード、その他のアドバイスや推奨を意図するものではなく、それらを構成するものでもありません。詳細は利用規約をご覧ください。