4-Hour Chart (Macro Trend)
Structure: The Nifty is in an Aggressive Bullish Momentum phase, but the recent 4H candle shows a deep correction that broke below the lower trendline of the steep ascending channel. This signals a Market Structure Shift (MSS) on the aggressive short-term momentum. The correction closed right on the FVG (Fair Value Gap), suggesting this zone will be critical.
Key Levels:
Major Supply (Resistance): 25,950 - 26,100. This area (the high from Oct 23) is the immediate overhead hurdle. A break above 26,100 would target the ATH.
Major Demand (Support): 25,400 - 25,550. This area, which includes the largest FVG and a strong accumulation zone, is the must-hold level for the overall weekly bullish bias.
Outlook: The bias is Corrective within an Uptrend. We expect consolidation or a retest of the lower support levels before the bulls can attempt a fresh ATH breakout.
1-Hour Chart (Intermediate View)
Structure: The 1H chart shows a clear descending channel formed during Friday's trading, confirming the short-term correction. The index has lost momentum and closed near the day's low.
Key Levels:
Immediate Resistance: 25,900 (Previous swing low/upper channel boundary).
Immediate Support: 25,600 (Lower channel boundary/FVG zone).
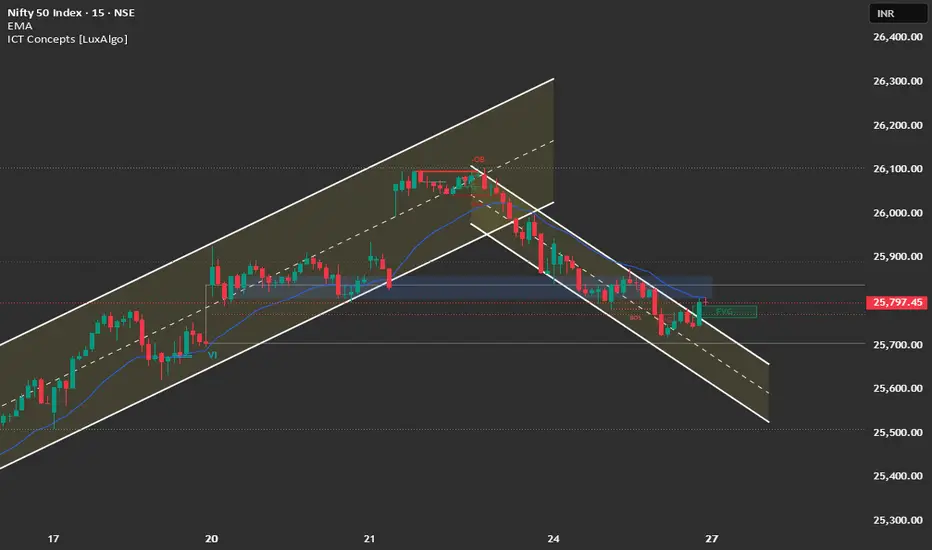
15-Minute Chart (Intraday View)
Structure: The 15M chart confirms the steep descending channel. The price is currently testing the lower end of the channel, having already broken the immediate short-term support and leaving an FVG overhead (around 25,900).
Key Levels:
Intraday Supply: 25,900.
Intraday Demand: 25,600.
Outlook: Bearish for the session open. A "Sell on Rise" strategy near the channel resistance is favorable.
📈 Trade Plan (Monday, 27th October)
Market Outlook: Nifty is undergoing a sharp correction, fueled by a renewed focus on global risks. The key lies in defending the 25,600 - 25,700 support zone.
Bearish Scenario (Primary Plan: Correction Continuation/Sell on Rise)
Justification: The breakdown of the steep channel and the formation of a descending channel favor continuation toward the 25,500 support.
Entry: Short entry on a retest and rejection of the 25,900 - 25,950 level (upper channel/FVG) OR Short a decisive break and 15-minute candle close below 25,750.
Stop Loss (SL): Place a stop loss above 26,000 (above the last swing high).
Targets:
T1: 25,600 (Lower channel support/Major FVG).
T2: 25,500 (Major weekly support).
Bullish Scenario (Counter-Trend/Bounce)
Justification: The macro trend remains bullish. A strong bounce from support is possible.
Trigger: A sustained move and close above 26,000.
Entry: Long entry on a confirmed 15-minute close above 26,000.
Stop Loss (SL): Below 25,850.
Targets:
T1: 26,100 (Retest of previous high).
T2: 26,277 (All-Time High).
Key Levels for Observation:
Immediate Decision Point: 25,750 - 25,900 zone.
Bearish Confirmation: Sustained trade below 25,750.
Bullish Warning: A move back above 26,000.
Line in the Sand: 25,500. Below this level, the risk of a deep correction increases significantly.
Structure: The Nifty is in an Aggressive Bullish Momentum phase, but the recent 4H candle shows a deep correction that broke below the lower trendline of the steep ascending channel. This signals a Market Structure Shift (MSS) on the aggressive short-term momentum. The correction closed right on the FVG (Fair Value Gap), suggesting this zone will be critical.
Key Levels:
Major Supply (Resistance): 25,950 - 26,100. This area (the high from Oct 23) is the immediate overhead hurdle. A break above 26,100 would target the ATH.
Major Demand (Support): 25,400 - 25,550. This area, which includes the largest FVG and a strong accumulation zone, is the must-hold level for the overall weekly bullish bias.
Outlook: The bias is Corrective within an Uptrend. We expect consolidation or a retest of the lower support levels before the bulls can attempt a fresh ATH breakout.
1-Hour Chart (Intermediate View)
Structure: The 1H chart shows a clear descending channel formed during Friday's trading, confirming the short-term correction. The index has lost momentum and closed near the day's low.
Key Levels:
Immediate Resistance: 25,900 (Previous swing low/upper channel boundary).
Immediate Support: 25,600 (Lower channel boundary/FVG zone).
15-Minute Chart (Intraday View)
Structure: The 15M chart confirms the steep descending channel. The price is currently testing the lower end of the channel, having already broken the immediate short-term support and leaving an FVG overhead (around 25,900).
Key Levels:
Intraday Supply: 25,900.
Intraday Demand: 25,600.
Outlook: Bearish for the session open. A "Sell on Rise" strategy near the channel resistance is favorable.
📈 Trade Plan (Monday, 27th October)
Market Outlook: Nifty is undergoing a sharp correction, fueled by a renewed focus on global risks. The key lies in defending the 25,600 - 25,700 support zone.
Bearish Scenario (Primary Plan: Correction Continuation/Sell on Rise)
Justification: The breakdown of the steep channel and the formation of a descending channel favor continuation toward the 25,500 support.
Entry: Short entry on a retest and rejection of the 25,900 - 25,950 level (upper channel/FVG) OR Short a decisive break and 15-minute candle close below 25,750.
Stop Loss (SL): Place a stop loss above 26,000 (above the last swing high).
Targets:
T1: 25,600 (Lower channel support/Major FVG).
T2: 25,500 (Major weekly support).
Bullish Scenario (Counter-Trend/Bounce)
Justification: The macro trend remains bullish. A strong bounce from support is possible.
Trigger: A sustained move and close above 26,000.
Entry: Long entry on a confirmed 15-minute close above 26,000.
Stop Loss (SL): Below 25,850.
Targets:
T1: 26,100 (Retest of previous high).
T2: 26,277 (All-Time High).
Key Levels for Observation:
Immediate Decision Point: 25,750 - 25,900 zone.
Bearish Confirmation: Sustained trade below 25,750.
Bullish Warning: A move back above 26,000.
Line in the Sand: 25,500. Below this level, the risk of a deep correction increases significantly.
免責事項
この情報および投稿は、TradingViewが提供または推奨する金融、投資、トレード、その他のアドバイスや推奨を意図するものではなく、それらを構成するものでもありません。詳細は利用規約をご覧ください。
免責事項
この情報および投稿は、TradingViewが提供または推奨する金融、投資、トレード、その他のアドバイスや推奨を意図するものではなく、それらを構成するものでもありません。詳細は利用規約をご覧ください。