Market Context: The Nifty snapped its eight-day losing streak on Wednesday (October 1st), following the RBI MPC decision to hold the repo rate. This confirms a strong reversal from the critical 24,600 support zone.
Detailed Market Structure Breakdown
4-Hour Chart (Macro Trend)
Structure: The Nifty has decisively broken out of the steep descending corrective channel. The strong bullish candle on Wednesday (October 1st) has closed well above the channel's upper trendline, signaling a high-probability short-term reversal. The market has now recovered more than 50% of the last major leg down.
Key Levels:
Major Supply (Resistance): 25,050 - 25,150. This area is the next significant hurdle, aligning with the prior consolidation zone.
Major Demand (Support): 24,600 - 24,700. This is the key reversal zone. As long as the Nifty trades above 24,700, the bullish bounce is in control.
Outlook: The short-term bias has shifted from bearish to cautiously bullish. The trend will be "Buy on Dips" until the index retests the 25,150 zone.
1-Hour Chart (Intermediate View)
Structure: The 1H chart shows a clear Break of Structure (BOS) on the upside, as the price broke the descending channel and closed strongly. The market is now back in a short-term upward trajectory.
Key Levels:
Immediate Resistance: 24,880. This is the high of the current bounce and a minor psychological resistance.
Immediate Support: 24,750 (The top of the recent consolidation and FVG support).
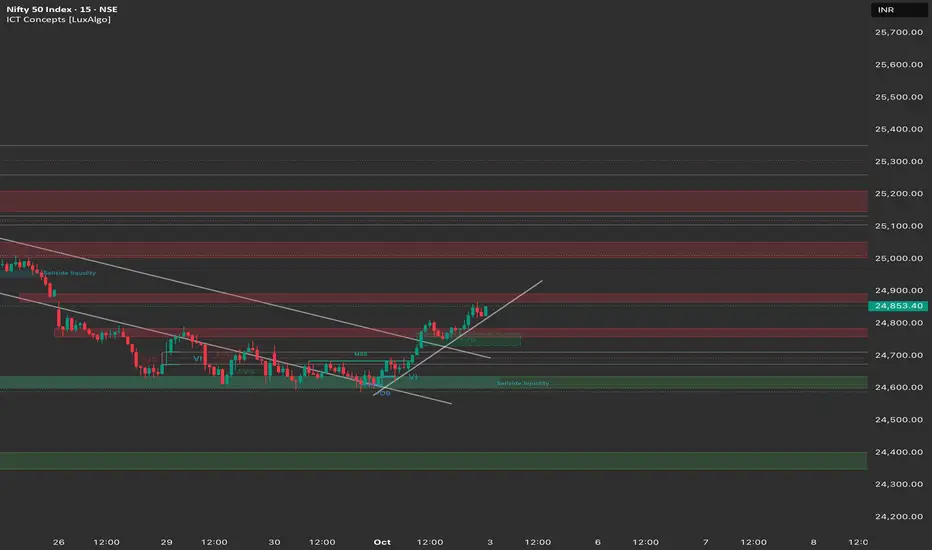
15-Minute Chart (Intraday View)
Structure: The 15M chart shows strong bullish momentum. The index successfully took out Sell-side Liquidity below 24,600 and then reversed sharply. It closed strongly above the EMA and is forming a continuation pattern (flag) right below 24,900.
Key Levels:
Intraday Supply: 24,900.
Intraday Demand: 24,800.
Outlook: Strongly Bullish for the session open.
📈 Trade Plan (Friday, 3rd October)
Market Outlook: The Nifty is in a strong bounce phase after the RBI policy catalyst. The primary strategy will be to buy on dips or buy on continuation.
Bullish Scenario (Primary Plan)
Justification: The strong close and confirmed reversal pattern across timeframes favor continuation towards the next major supply zone.
Entry: Long entry on a decisive break and 15-minute candle close above 24,900. Alternatively, look for a dip entry near 24,750 if the market retraces.
Stop Loss (SL): Place a stop loss below 24,700 (below the immediate FVG support).
Targets:
T1: 25,050 (Psychological level).
T2: 25,150 (Major supply zone).
T3: 25,250 (Upper resistance).
Bearish Scenario (Counter-Trend Plan)
Justification: This high-risk, counter-trend plan only becomes valid if the bounce is completely rejected.
Trigger: A decisive break and 1-hour candle close below 24,700.
Entry: Short entry below 24,700.
Stop Loss (SL): Above 24,850 (above the recent swing high).
Targets:
T1: 24,600 (Key reversal support).
T2: 24,400 (Deeper demand zone).
[b]Key Levels for Observation:
Immediate Decision Point: 24,800 - 24,900 zone.
Bullish Confirmation: A break and sustained move above 24,900.
Bearish Warning: A move below 24,700 suggests a reversal failure and consolidation.
Line in the Sand: 24,600. A break below this level nullifies the reversal bounce.
Detailed Market Structure Breakdown
4-Hour Chart (Macro Trend)
Structure: The Nifty has decisively broken out of the steep descending corrective channel. The strong bullish candle on Wednesday (October 1st) has closed well above the channel's upper trendline, signaling a high-probability short-term reversal. The market has now recovered more than 50% of the last major leg down.
Key Levels:
Major Supply (Resistance): 25,050 - 25,150. This area is the next significant hurdle, aligning with the prior consolidation zone.
Major Demand (Support): 24,600 - 24,700. This is the key reversal zone. As long as the Nifty trades above 24,700, the bullish bounce is in control.
Outlook: The short-term bias has shifted from bearish to cautiously bullish. The trend will be "Buy on Dips" until the index retests the 25,150 zone.
1-Hour Chart (Intermediate View)
Structure: The 1H chart shows a clear Break of Structure (BOS) on the upside, as the price broke the descending channel and closed strongly. The market is now back in a short-term upward trajectory.
Key Levels:
Immediate Resistance: 24,880. This is the high of the current bounce and a minor psychological resistance.
Immediate Support: 24,750 (The top of the recent consolidation and FVG support).
15-Minute Chart (Intraday View)
Structure: The 15M chart shows strong bullish momentum. The index successfully took out Sell-side Liquidity below 24,600 and then reversed sharply. It closed strongly above the EMA and is forming a continuation pattern (flag) right below 24,900.
Key Levels:
Intraday Supply: 24,900.
Intraday Demand: 24,800.
Outlook: Strongly Bullish for the session open.
📈 Trade Plan (Friday, 3rd October)
Market Outlook: The Nifty is in a strong bounce phase after the RBI policy catalyst. The primary strategy will be to buy on dips or buy on continuation.
Bullish Scenario (Primary Plan)
Justification: The strong close and confirmed reversal pattern across timeframes favor continuation towards the next major supply zone.
Entry: Long entry on a decisive break and 15-minute candle close above 24,900. Alternatively, look for a dip entry near 24,750 if the market retraces.
Stop Loss (SL): Place a stop loss below 24,700 (below the immediate FVG support).
Targets:
T1: 25,050 (Psychological level).
T2: 25,150 (Major supply zone).
T3: 25,250 (Upper resistance).
Bearish Scenario (Counter-Trend Plan)
Justification: This high-risk, counter-trend plan only becomes valid if the bounce is completely rejected.
Trigger: A decisive break and 1-hour candle close below 24,700.
Entry: Short entry below 24,700.
Stop Loss (SL): Above 24,850 (above the recent swing high).
Targets:
T1: 24,600 (Key reversal support).
T2: 24,400 (Deeper demand zone).
[b]Key Levels for Observation:
Immediate Decision Point: 24,800 - 24,900 zone.
Bullish Confirmation: A break and sustained move above 24,900.
Bearish Warning: A move below 24,700 suggests a reversal failure and consolidation.
Line in the Sand: 24,600. A break below this level nullifies the reversal bounce.
免責事項
これらの情報および投稿は、TradingViewが提供または保証する金融、投資、取引、またはその他の種類のアドバイスや推奨を意図したものではなく、またそのようなものでもありません。詳しくは利用規約をご覧ください。
免責事項
これらの情報および投稿は、TradingViewが提供または保証する金融、投資、取引、またはその他の種類のアドバイスや推奨を意図したものではなく、またそのようなものでもありません。詳しくは利用規約をご覧ください。