🔎 Nifty Technical View
Higher Timeframe (4H)
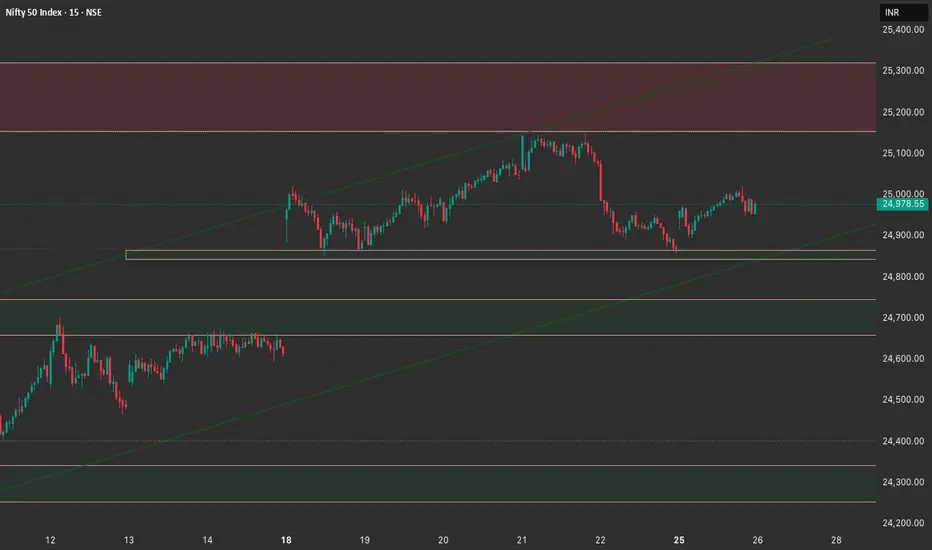
Resistance Zone: 25,200 – 25,300 (supply zone overhead).
Support Zone: 24,900 (immediate) and 24,700 (major demand).
Price tested the 24,900 demand and bounced slightly. Still within a short-term corrective phase inside an upward channel.
Medium Timeframe (1H)
Price is consolidating around 24,950 – 25,000 after a pullback.
Structure is still bullish as long as 24,900 holds.
A clean breakout above 25,050 can re-test 25,200 – 25,300.
But, if 24,900 breaks, momentum could shift bearish toward lower demand.
Lower Timeframe (15M)
Short-term demand OB at 24,920 – 24,950 is active.
Multiple BOS (break of structure) show intraday buyers are still defending, but rejection wicks indicate strong sellers near 25,050.
Key decision point: 24,900 – 24,950 zone.
📌 Trading Plan for 26th August
Long Setup
Trigger: Break & close above 25,050.
Targets: 25,100 → 25,200 → 25,300.
Stop-loss: Below 24,950.
Bias: Go long only on a strong breakout, otherwise avoid chop around 25k.
Short Setup
Trigger: Breakdown & close below 24,900.
Targets: 24,850 → 24,750 → 24,700.
Stop-loss: Above 24,950.
Bias: Play short if 24,900 gives way with momentum.
✅ Summary
Bias: Neutral-to-bullish as long as 24,900 holds.
Key Levels:
Resistance: 25,050 → 25,200 – 25,300.
Support: 24,950 → 24,900 → 24,700.
Tomorrow’s action likely revolves around 24,900 – 25,050 range; breakout or breakdown will decide trend expansion.
Higher Timeframe (4H)
Resistance Zone: 25,200 – 25,300 (supply zone overhead).
Support Zone: 24,900 (immediate) and 24,700 (major demand).
Price tested the 24,900 demand and bounced slightly. Still within a short-term corrective phase inside an upward channel.
Medium Timeframe (1H)
Price is consolidating around 24,950 – 25,000 after a pullback.
Structure is still bullish as long as 24,900 holds.
A clean breakout above 25,050 can re-test 25,200 – 25,300.
But, if 24,900 breaks, momentum could shift bearish toward lower demand.
Lower Timeframe (15M)
Short-term demand OB at 24,920 – 24,950 is active.
Multiple BOS (break of structure) show intraday buyers are still defending, but rejection wicks indicate strong sellers near 25,050.
Key decision point: 24,900 – 24,950 zone.
📌 Trading Plan for 26th August
Long Setup
Trigger: Break & close above 25,050.
Targets: 25,100 → 25,200 → 25,300.
Stop-loss: Below 24,950.
Bias: Go long only on a strong breakout, otherwise avoid chop around 25k.
Short Setup
Trigger: Breakdown & close below 24,900.
Targets: 24,850 → 24,750 → 24,700.
Stop-loss: Above 24,950.
Bias: Play short if 24,900 gives way with momentum.
✅ Summary
Bias: Neutral-to-bullish as long as 24,900 holds.
Key Levels:
Resistance: 25,050 → 25,200 – 25,300.
Support: 24,950 → 24,900 → 24,700.
Tomorrow’s action likely revolves around 24,900 – 25,050 range; breakout or breakdown will decide trend expansion.
免責事項
この情報および投稿は、TradingViewが提供または推奨する金融、投資、トレード、その他のアドバイスや推奨を意図するものではなく、それらを構成するものでもありません。詳細は利用規約をご覧ください。
免責事項
この情報および投稿は、TradingViewが提供または推奨する金融、投資、トレード、その他のアドバイスや推奨を意図するものではなく、それらを構成するものでもありません。詳細は利用規約をご覧ください。