In previous chart, Expected upsurge accomplished:

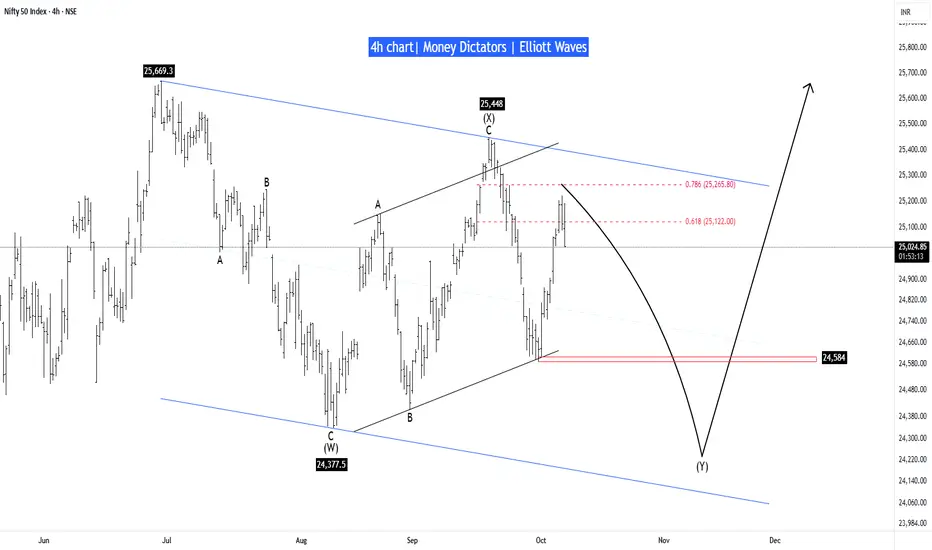
Nifty has reached the optimal supply zone and is expected to decline, at least up to 24,584. The retracement of wave A (0.786) could act as a strong resistance for a reversal. The lower boundary lies at 24,120, while 24,377 marks the low of wave (W). It’s better to consider the lower boundary as the potential maximum downside level.
Once the reversal level is identified, we will proceed toward the bullish path.
Stay tuned!
Money_Dictators
Thanks :)
Life-time free telegram channel - t.me/moneydictators
関連の投稿
免責事項
これらの情報および投稿は、TradingViewが提供または保証する金融、投資、取引、またはその他の種類のアドバイスや推奨を意図したものではなく、またそのようなものでもありません。詳しくは利用規約をご覧ください。
Life-time free telegram channel - t.me/moneydictators
関連の投稿
免責事項
これらの情報および投稿は、TradingViewが提供または保証する金融、投資、取引、またはその他の種類のアドバイスや推奨を意図したものではなく、またそのようなものでもありません。詳しくは利用規約をご覧ください。