📊 Market Observation | August 1, 2025
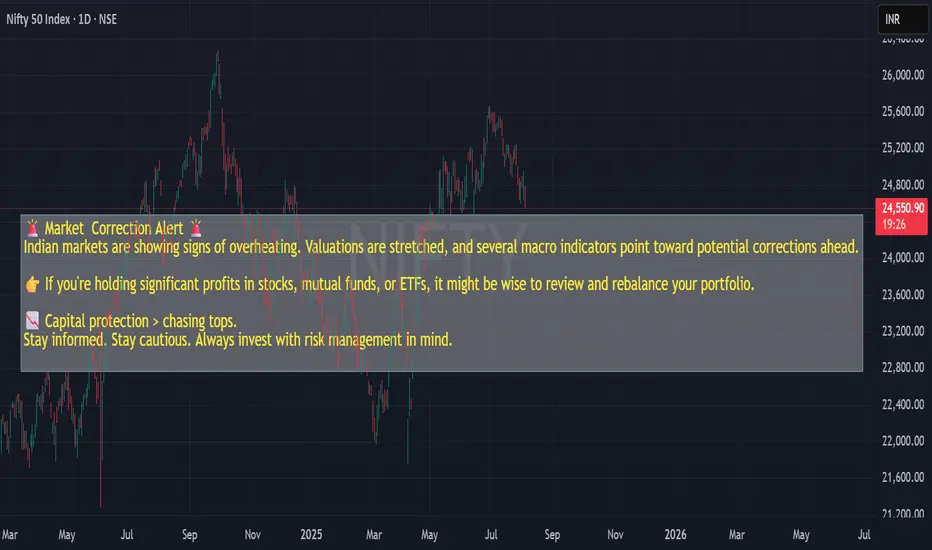
This Nifty 50 daily chart highlights potential macro risks that may influence investor behavior.
🧠 Key Insights:
- Valuations appear stretched on multiple metrics.
- Price structure has formed lower highs post-peak.
- Macro indicators suggest possible correction ahead.
🟡 Educational Note:
If you're holding long-term positions, this may be a good time to revisit portfolio allocations with a focus on capital preservation.
📌 Risk Management Reminder:
Capital protection often outweighs return chasing near potential tops.
All observations are structure-based and educational. This is not financial advice.
免責事項
この情報および投稿は、TradingViewが提供または推奨する金融、投資、トレード、その他のアドバイスや推奨を意図するものではなく、それらを構成するものでもありません。詳細は利用規約をご覧ください。
免責事項
この情報および投稿は、TradingViewが提供または推奨する金融、投資、トレード、その他のアドバイスや推奨を意図するものではなく、それらを構成するものでもありません。詳細は利用規約をご覧ください。
