The market sentiment has shifted from strongly bullish to cautiously bearish in the short term. The Nifty closed at 25,185.80, down 0.07% on the day, after hitting a low of 25,084.65.
Detailed Market Structure Breakdown
4-Hour Chart (Macro Trend)
Structure: The long-term trend remains bullish, but the index has now broken below its short-term rising channel, which is a significant sign of weakness. The last few candles show strong selling pressure, and the price is hovering right above a crucial demand zone.
Key Levels:
Major Supply (Resistance): 25,300 - 25,400. This area served as support on the way up and is now a major resistance. Any bounce is likely to be met with selling pressure in this zone.
Major Demand (Support): The most critical support is the 25,050 - 25,100 zone. This area, which includes a prior breakout level and a FVG (Fair Value Gap), is now the key "line in the sand" for the long-term bullish trend. A break below this would signal a major trend reversal.
1-Hour Chart (Intermediate View)
Structure: The 1H chart shows a clear MSS (Market Structure Shift) to the downside. The price has broken below multiple key supports and is now making lower highs and lower lows. The market is in a clear downtrend on this timeframe.
Key Levels:
Immediate Resistance: The 25,250 level is a crucial resistance now.
Immediate Support: The 25,100 level is the key support to watch. The price has already tested this zone.
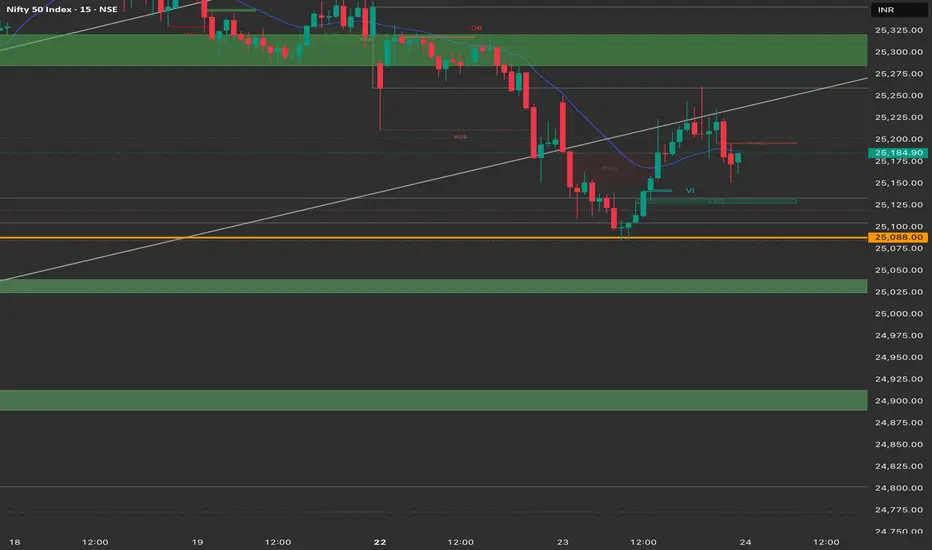
15-Minute Chart (Intraday View)
Structure: The 15M chart shows that the index is in a corrective phase, having bounced off the crucial 25,100 support. However, it is now trading below the blue EMA, which acts as resistance. The price is currently consolidating between 25,150 and 25,200.
Key Levels:
Intraday Supply: The 25,200 area, which is the high of the recent consolidation.
Intraday Demand: The low of the recent consolidation and the intraday low, near 25,100.
Outlook: The intraday bias is cautiously bearish. The market is likely to remain volatile as it decides its next move.
Trade Plan (Tuesday, 24th September)
Market Outlook: The Nifty has shifted to a short-term bearish phase. A "sell on rise" strategy seems more favorable, but a strong reversal from the key 25,100 support level is also a possibility.
Bearish Scenario (Primary Plan)
Justification: The market has shown a clear change in structure with a breakdown of key levels. The path of least resistance is to the downside.
Entry: Look for a short entry if the price retests the 25,250 level and shows signs of rejection. Alternatively, a breakdown and 15-minute close below 25,100 would trigger a short entry.
Stop Loss (SL): Place a stop loss above 25,300.
Targets:
T1: 25,050 (Next major support).
T2: 24,950 (Psychological level and demand zone).
Bullish Scenario (Counter-Trend Plan)
Justification: This is a counter-trend plan and should be approached with caution. It is based on the possibility of a strong bounce from a key support level.
Trigger: A strong bullish reversal candle (e.g., a hammer or engulfing pattern) near the 25,050 - 25,100 demand zone.
Entry: Long entry on a confirmed bounce from the demand zone.
Stop Loss (SL): Below 25,000.
Targets:
T1: 25,200 (Intraday resistance).
T2: 25,300 (Recent swing high).
Key Levels for Observation:
Immediate Decision Point: The 25,100 - 25,200 zone.
Bearish Confirmation: A break and sustained move below 25,100.
Bullish Confirmation: A recapture of the 25,250 level.
Line in the Sand: The 25,050 - 25,100 zone. The overall bullish trend is in jeopardy if this level is decisively broken.
免責事項
この情報および投稿は、TradingViewが提供または推奨する金融、投資、トレード、その他のアドバイスや推奨を意図するものではなく、それらを構成するものでもありません。詳細は利用規約をご覧ください。
免責事項
この情報および投稿は、TradingViewが提供または推奨する金融、投資、トレード、その他のアドバイスや推奨を意図するものではなく、それらを構成するものでもありません。詳細は利用規約をご覧ください。