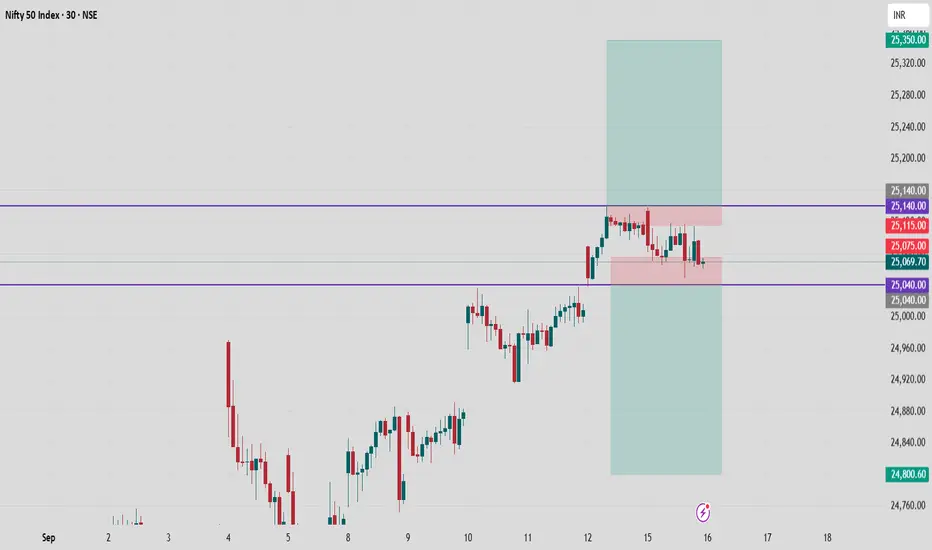
Nifty 50 Index is currently trading in a defined range, showing clear support and resistance on the 15-minute chart. Price action is consolidating between 25,040 and 25,140, indicating a sideways market phase perfect for range-based strategies.
Key Levels and Range
Resistance Zone: 25,140
Support Zone: 25,040
Current Price: 25,069.70
Observe rejection and congestion near these levels; strong movement is likely only on a breakout beyond this band.
Trading Setup
Bullish Scenario:
Go long on a breakout above 25,140.
Targets: 25,350.
Stop-Loss: Below 25,100.
Bearish Scenario:
Go short on a breakdown below 25,040.
Targets: 24,800.
Stop-Loss: Above 25,075.
Guidance
Aided by the highlighted red range, Nifty is accumulating energy for the next move.
Use strict risk management — trade only on valid breakout/breakdown candle closes for best results.
Stay alert for volume confirmation at breakout levels.
Trade with discipline — let price tell its story before reacting.
Follow for more such updates!
Technical Chart Analyst
Track: Indian & US Markets
Indices | Commodities | Crypto
Telegram: @ChartPathik for NSE & MCX
& @ChartPathik_Global for US Ins. & Crypto
WhatsApp: +91-99293-91467 for updates.
Track: Indian & US Markets
Indices | Commodities | Crypto
Telegram: @ChartPathik for NSE & MCX
& @ChartPathik_Global for US Ins. & Crypto
WhatsApp: +91-99293-91467 for updates.
免責事項
これらの情報および投稿は、TradingViewが提供または保証する金融、投資、取引、またはその他の種類のアドバイスや推奨を意図したものではなく、またそのようなものでもありません。詳しくは利用規約をご覧ください。