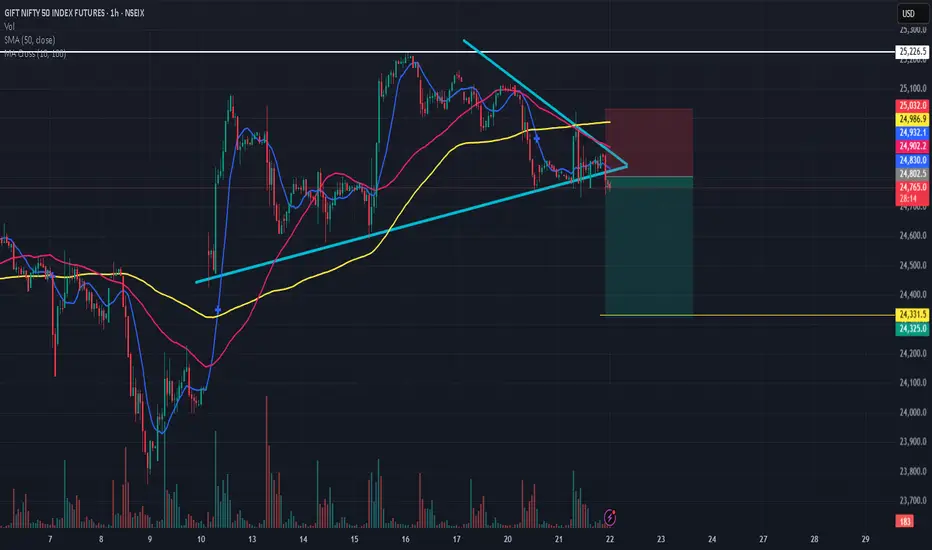
A triangle chart pattern is a tool used in technical analysis. Named for its resemblance to a series of triangles, the triangle chart pattern is created by drawing trendlines along a converging price range. The result signals a pause in the prevailing trend.
Technical analysts read the triangle as an indicator of a continuation of an existing trend or reversal.
Despite being a continuation, traders should look for breakouts before they make a move to buy or sell.
Technical analysts read the triangle as an indicator of a continuation of an existing trend or reversal.
Despite being a continuation, traders should look for breakouts before they make a move to buy or sell.
免責事項
これらの情報および投稿は、TradingViewが提供または保証する金融、投資、取引、またはその他の種類のアドバイスや推奨を意図したものではなく、またそのようなものでもありません。詳しくは利用規約をご覧ください。
免責事項
これらの情報および投稿は、TradingViewが提供または保証する金融、投資、取引、またはその他の種類のアドバイスや推奨を意図したものではなく、またそのようなものでもありません。詳しくは利用規約をご覧ください。