See Chart
ノート
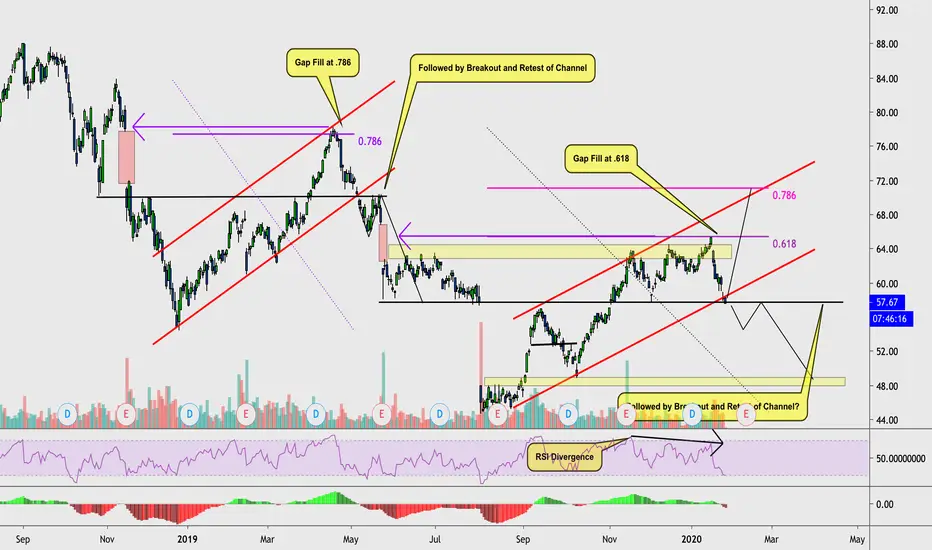
meant to label as a shortトレード稼働中
Price made the forecasted bearish breakout and is currently retesting the broken $58 structure as resistance just as it did back between 16-24 of May 2019. This provides us with an interesting pattern that follows historical price action. Will be looking to enter short if structure holds.ノート
Price is moving perfectly according to plan! 免責事項
これらの情報および投稿は、TradingViewが提供または保証する金融、投資、取引、またはその他の種類のアドバイスや推奨を意図したものではなく、またそのようなものでもありません。詳しくは利用規約をご覧ください。
免責事項
これらの情報および投稿は、TradingViewが提供または保証する金融、投資、取引、またはその他の種類のアドバイスや推奨を意図したものではなく、またそのようなものでもありません。詳しくは利用規約をご覧ください。