Here’s my take on Nvidia heading into Wednesday’s session, based on the 1-hour chart and current GEX data.
1️⃣ Price Action & Market Structure
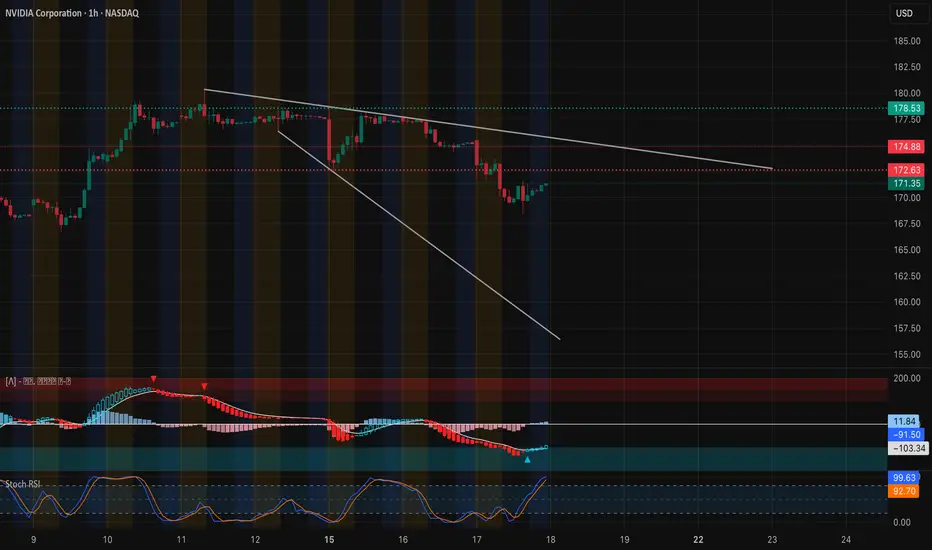
* Trend check: NVDA is still in a short-term downtrend after last week’s selloff, but buyers stepped in near $168–170, which lines up with prior volume support.
* Key level: $172.5 is a near-term pivot. Price is testing it now; a sustained push above could start a relief bounce toward $175–177.
* Resistance overhead: The descending trendline around $174.8–175 is the first real test for bulls. Above that, $178.5 and $182.5 are next supply zones.

2️⃣ GEX (Options Flow) Read
* Call/put balance: Calls only about 25% of flow—puts still dominate, showing cautious sentiment.
* Put walls: Big put interest at $170 and $165 creates a “magnet” if $172.5 fails.
* Call side: Not much until $177.5 and $182.5, where gamma clusters could help a squeeze if buyers surprise.
3️⃣ Trading Thoughts
* Conservative long scalp: If NVDA closes an hourly candle above $172.5–174, a pop toward $177–178.5 is on the table. Tight stop under $170.
* Short setup: If price rejects $172.5 and slips back below $170, expect a quick test of $167.5, maybe $165 on momentum.
4️⃣ Option Angle
* Directional play: Debit spreads (e.g., $175/$180 calls) are fine for a bounce if price confirms over $174.
* Income angle: Credit spreads selling $165 puts or $180 calls fit a range-bound view if you expect more chop.
5️⃣ My View
Nvidia is oversold enough to bounce, but the overall tape is still heavy. I’ll wait for an hourly close over $174 to trust the long side. Otherwise, any fade below $170 keeps the short trend alive.
Disclaimer: This analysis is for educational discussion only and does not constitute financial advice. Always do your own research and manage risk before trading.
1️⃣ Price Action & Market Structure
* Trend check: NVDA is still in a short-term downtrend after last week’s selloff, but buyers stepped in near $168–170, which lines up with prior volume support.
* Key level: $172.5 is a near-term pivot. Price is testing it now; a sustained push above could start a relief bounce toward $175–177.
* Resistance overhead: The descending trendline around $174.8–175 is the first real test for bulls. Above that, $178.5 and $182.5 are next supply zones.
2️⃣ GEX (Options Flow) Read
* Call/put balance: Calls only about 25% of flow—puts still dominate, showing cautious sentiment.
* Put walls: Big put interest at $170 and $165 creates a “magnet” if $172.5 fails.
* Call side: Not much until $177.5 and $182.5, where gamma clusters could help a squeeze if buyers surprise.
3️⃣ Trading Thoughts
* Conservative long scalp: If NVDA closes an hourly candle above $172.5–174, a pop toward $177–178.5 is on the table. Tight stop under $170.
* Short setup: If price rejects $172.5 and slips back below $170, expect a quick test of $167.5, maybe $165 on momentum.
4️⃣ Option Angle
* Directional play: Debit spreads (e.g., $175/$180 calls) are fine for a bounce if price confirms over $174.
* Income angle: Credit spreads selling $165 puts or $180 calls fit a range-bound view if you expect more chop.
5️⃣ My View
Nvidia is oversold enough to bounce, but the overall tape is still heavy. I’ll wait for an hourly close over $174 to trust the long side. Otherwise, any fade below $170 keeps the short trend alive.
Disclaimer: This analysis is for educational discussion only and does not constitute financial advice. Always do your own research and manage risk before trading.
免責事項
これらの情報および投稿は、TradingViewが提供または保証する金融、投資、取引、またはその他の種類のアドバイスや推奨を意図したものではなく、またそのようなものでもありません。詳しくは利用規約をご覧ください。
免責事項
これらの情報および投稿は、TradingViewが提供または保証する金融、投資、取引、またはその他の種類のアドバイスや推奨を意図したものではなく、またそのようなものでもありません。詳しくは利用規約をご覧ください。