NVIDIA had one of the toughest weeks in months — the stock dropped nearly 5% on Friday as traders rushed to safety during the volatility spike. What we’re looking at now is not just a dip — it’s a real battle between smart money reloading for the next wave and panic sellers trying to exit before another flush.
Let’s break down both the 15-minute intraday structure and the 1-hour GEX setup to see what’s next.
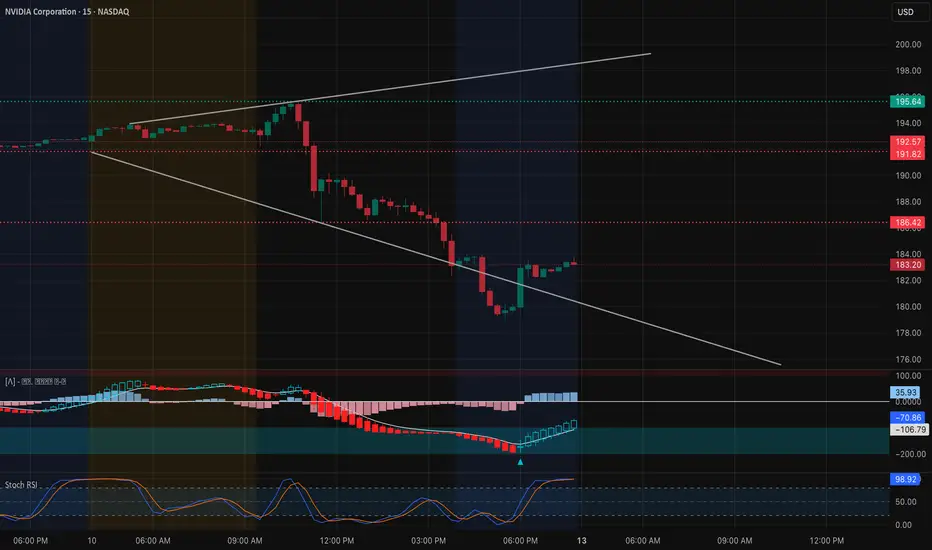
NVDA 15-Minute — Intraday Structure
Friday’s session was brutal. NVDA fell sharply from around 192.5 and closed near 183, creating a steep descending channel that’s still active.
* Trendline & Structure: The price is still trading below the descending trendline, but we’re starting to see the first signs of stabilization. The last few candles show a short-term bullish divergence forming on MACD, and Stoch RSI is recovering from oversold levels around 25. That tells us the selling momentum is cooling — at least for now.
* Immediate Resistance Zone: 186.4 – 188.0. This is the first area bears will defend. A clean breakout above 188 could trigger a quick move toward 192.5, where Friday’s breakdown began.
* Support Zone: 177 – 180. This is the current intraday demand area. If we see another pullback here at the open, I expect buyers to step in — but if this level breaks, the door opens toward 172, the next strong support below.
* Intraday Plan: I’d watch how NVDA behaves at 185 – 186 early in the morning. If it rejects this zone and VIX spikes again, short scalps back to 180 make sense. But if SPY shows strength and VIX cools under 20, NVDA could run a relief move toward 190–192 for a day trade.
NVDA 1-Hour GEX Chart — Options Sentiment

Now this is where things get really interesting.
From the Options GEX [PRO] and Options Oscillator, we’re seeing how the option market is currently positioned around NVDA:
* Highest Positive Net GEX / Call Resistance: ~188–192.5 That’s the wall where call sellers sit — heavy resistance for now.
* HVL & Short-Term Gamma Level: ~177.5 This level marks the highest volatility line (HVL). Below that, gamma flips negative, meaning dealers will start shorting to hedge, which amplifies downside moves.
* Put Support: ~170–172 zone, where negative GEX peaks (-61%). That’s the line in the sand for deeper correction.
* IVR / IVX: 22.4 / 51.4 → Volatility is elevated but not extreme. There’s still room for expansion if fear continues.
What this tells me: NVDA is caught right between strong call resistance and heavy put support. Whichever side breaks first will dictate the next big move.
My Thoughts & Trade Ideas
From a technical perspective, NVDA is in a short-term bearish trend, but it’s also sitting at a potential bounce zone. The risk/reward for bulls improves here if volatility doesn’t expand further.
For Intraday Traders:
* I’d wait for confirmation at the open.
* A push above 186–188 could trigger quick long scalps to 191–192.5.
* Failure there? Short setups back to 180 with tight stops above 188.
For Options Traders:
* Calls near the 180 strike for quick rebounds are fine if VIX fades early — but keep expirations tight (1DTE or 2DTE).
* If volatility remains high and NVDA fails 180, puts around 177–175 may gain traction into midweek.
The Bigger Picture
Friday’s move wasn’t just about NVDA — it was all fear-driven. VIX broke 21, SPY collapsed, and traders de-risked across the board. If volatility holds above 20.6 into Monday, NVDA will likely stay under pressure. But if the market calms, this could be the level where smart money quietly reloads for the next move up.
So going into Oct. 13, I’m cautious but watching for a reversal attempt. The moment NVDA breaks its 15-minute trendline and clears 188 with volume, the sentiment flips bullish short-term.
Key Takeaway: NVDA is sitting right in the middle of a gamma battlefield. 180 is the must-hold level, 192 is the breakout gate. Volatility will decide the winner.
Disclaimer: This analysis is for educational purposes only and not financial advice. Always do your own research and manage risk carefully.
Let’s break down both the 15-minute intraday structure and the 1-hour GEX setup to see what’s next.
NVDA 15-Minute — Intraday Structure
Friday’s session was brutal. NVDA fell sharply from around 192.5 and closed near 183, creating a steep descending channel that’s still active.
* Trendline & Structure: The price is still trading below the descending trendline, but we’re starting to see the first signs of stabilization. The last few candles show a short-term bullish divergence forming on MACD, and Stoch RSI is recovering from oversold levels around 25. That tells us the selling momentum is cooling — at least for now.
* Immediate Resistance Zone: 186.4 – 188.0. This is the first area bears will defend. A clean breakout above 188 could trigger a quick move toward 192.5, where Friday’s breakdown began.
* Support Zone: 177 – 180. This is the current intraday demand area. If we see another pullback here at the open, I expect buyers to step in — but if this level breaks, the door opens toward 172, the next strong support below.
* Intraday Plan: I’d watch how NVDA behaves at 185 – 186 early in the morning. If it rejects this zone and VIX spikes again, short scalps back to 180 make sense. But if SPY shows strength and VIX cools under 20, NVDA could run a relief move toward 190–192 for a day trade.
NVDA 1-Hour GEX Chart — Options Sentiment
Now this is where things get really interesting.
From the Options GEX [PRO] and Options Oscillator, we’re seeing how the option market is currently positioned around NVDA:
* Highest Positive Net GEX / Call Resistance: ~188–192.5 That’s the wall where call sellers sit — heavy resistance for now.
* HVL & Short-Term Gamma Level: ~177.5 This level marks the highest volatility line (HVL). Below that, gamma flips negative, meaning dealers will start shorting to hedge, which amplifies downside moves.
* Put Support: ~170–172 zone, where negative GEX peaks (-61%). That’s the line in the sand for deeper correction.
* IVR / IVX: 22.4 / 51.4 → Volatility is elevated but not extreme. There’s still room for expansion if fear continues.
What this tells me: NVDA is caught right between strong call resistance and heavy put support. Whichever side breaks first will dictate the next big move.
My Thoughts & Trade Ideas
From a technical perspective, NVDA is in a short-term bearish trend, but it’s also sitting at a potential bounce zone. The risk/reward for bulls improves here if volatility doesn’t expand further.
For Intraday Traders:
* I’d wait for confirmation at the open.
* A push above 186–188 could trigger quick long scalps to 191–192.5.
* Failure there? Short setups back to 180 with tight stops above 188.
For Options Traders:
* Calls near the 180 strike for quick rebounds are fine if VIX fades early — but keep expirations tight (1DTE or 2DTE).
* If volatility remains high and NVDA fails 180, puts around 177–175 may gain traction into midweek.
The Bigger Picture
Friday’s move wasn’t just about NVDA — it was all fear-driven. VIX broke 21, SPY collapsed, and traders de-risked across the board. If volatility holds above 20.6 into Monday, NVDA will likely stay under pressure. But if the market calms, this could be the level where smart money quietly reloads for the next move up.
So going into Oct. 13, I’m cautious but watching for a reversal attempt. The moment NVDA breaks its 15-minute trendline and clears 188 with volume, the sentiment flips bullish short-term.
Key Takeaway: NVDA is sitting right in the middle of a gamma battlefield. 180 is the must-hold level, 192 is the breakout gate. Volatility will decide the winner.
Disclaimer: This analysis is for educational purposes only and not financial advice. Always do your own research and manage risk carefully.
免責事項
この情報および投稿は、TradingViewが提供または推奨する金融、投資、トレード、その他のアドバイスや推奨を意図するものではなく、それらを構成するものでもありません。詳細は利用規約をご覧ください。
免責事項
この情報および投稿は、TradingViewが提供または推奨する金融、投資、トレード、その他のアドバイスや推奨を意図するものではなく、それらを構成するものでもありません。詳細は利用規約をご覧ください。