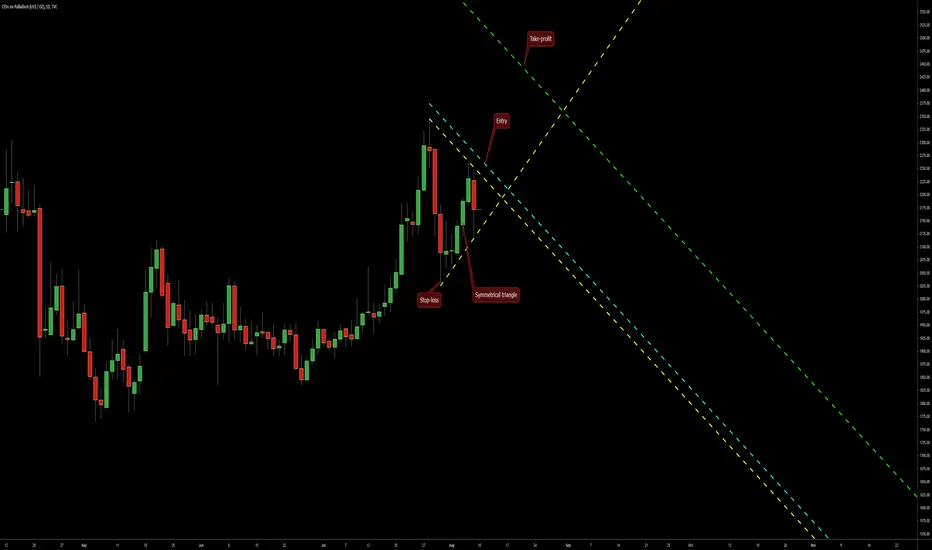
A symmetrical triangle formed on the daily chart of Palladium and now offers an opportunity to trade a bullish breakout setup. The triangle's borders are marked with the yellow lines. The potential entry level is shown with the cyan line. The potential take-profit level is where the green line is. Stop-loss can be set to the low of the triangle's base - at 2024.84.
免責事項
これらの情報および投稿は、TradingViewが提供または保証する金融、投資、取引、またはその他の種類のアドバイスや推奨を意図したものではなく、またそのようなものでもありません。詳しくは利用規約をご覧ください。
免責事項
これらの情報および投稿は、TradingViewが提供または保証する金融、投資、取引、またはその他の種類のアドバイスや推奨を意図したものではなく、またそのようなものでもありません。詳しくは利用規約をご覧ください。