PENDLEBTC 1D Chart Analysis | Accumulation Breakout Confirmed
🔍 Technical Breakdown
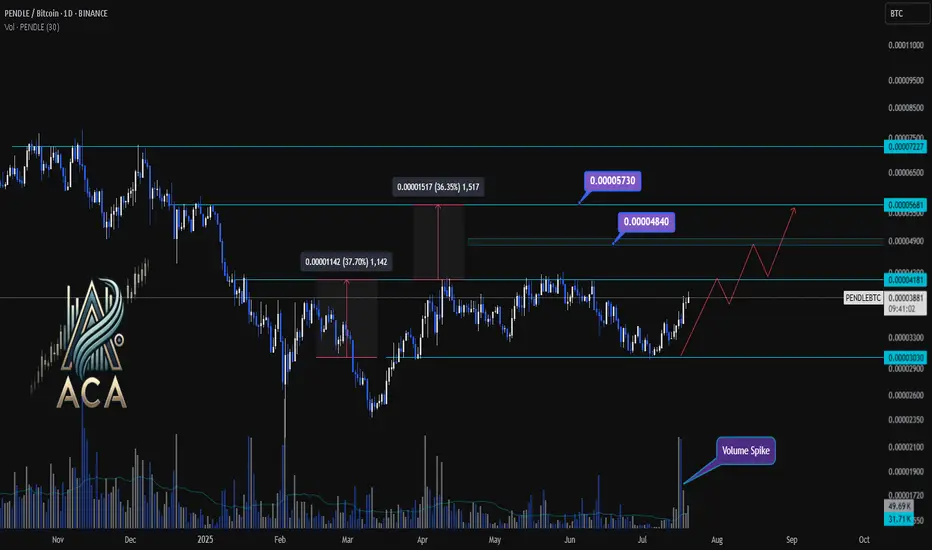
PENDLE/BTC has officially broken out above a key accumulation box, confirming strength as the daily candle closed above the 0.00004181 resistance zone. This marks a significant structural shift after months of sideways consolidation.
📈 Key Observations
Accumulation Phase: The prolonged sideways structure acted as a re-accumulation range. The recent breakout suggests strong hands absorbing supply before expansion.
Breakout Momentum: Prior rallies from this region resulted in +36% and +37% moves. Similar behavior is expected if this breakout sustains.
Target Zones:
🎯 First Target: 0.00004840 (mid-range resistance)
🎯 Extended Target: 0.00005730 (macro resistance)
📊 Volume Spike confirms genuine breakout demand. If BTC remains stable, PENDLE may repeat its historical rally patterns toward the upper resistance zones.
🚀 Conclusion
With a clean close above the range high and confirmed volume, PENDLE/BTC appears poised for further upside. Momentum traders may eye pullbacks into 0.00004180 as potential entries.
🔍 Technical Breakdown
PENDLE/BTC has officially broken out above a key accumulation box, confirming strength as the daily candle closed above the 0.00004181 resistance zone. This marks a significant structural shift after months of sideways consolidation.
📈 Key Observations
Accumulation Phase: The prolonged sideways structure acted as a re-accumulation range. The recent breakout suggests strong hands absorbing supply before expansion.
Breakout Momentum: Prior rallies from this region resulted in +36% and +37% moves. Similar behavior is expected if this breakout sustains.
Target Zones:
🎯 First Target: 0.00004840 (mid-range resistance)
🎯 Extended Target: 0.00005730 (macro resistance)
📊 Volume Spike confirms genuine breakout demand. If BTC remains stable, PENDLE may repeat its historical rally patterns toward the upper resistance zones.
🚀 Conclusion
With a clean close above the range high and confirmed volume, PENDLE/BTC appears poised for further upside. Momentum traders may eye pullbacks into 0.00004180 as potential entries.
関連の投稿
免責事項
これらの情報および投稿は、TradingViewが提供または保証する金融、投資、取引、またはその他の種類のアドバイスや推奨を意図したものではなく、またそのようなものでもありません。詳しくは利用規約をご覧ください。
免責事項
これらの情報および投稿は、TradingViewが提供または保証する金融、投資、取引、またはその他の種類のアドバイスや推奨を意図したものではなく、またそのようなものでもありません。詳しくは利用規約をご覧ください。