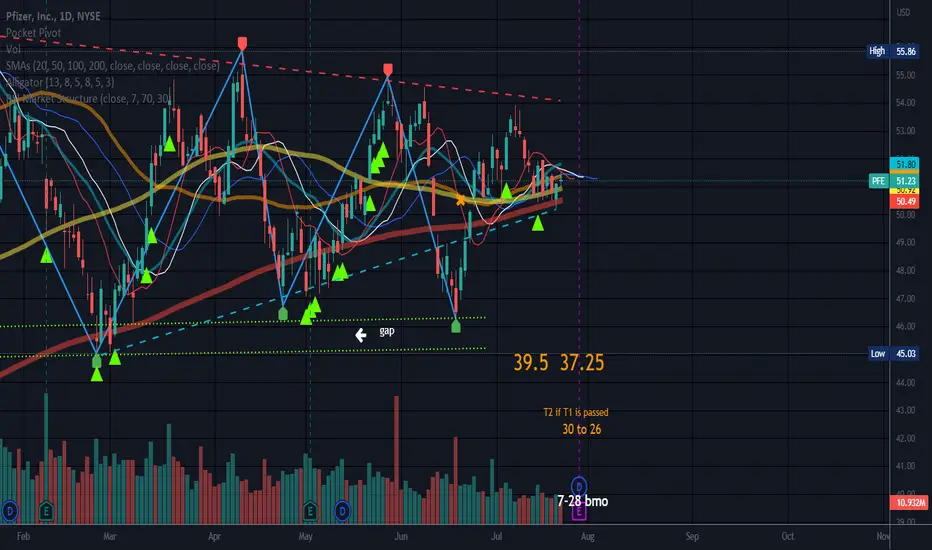
Earnings 7-28 BMO
Neutral pattern until a trendline is broken.
Targets over the triangle are bullish targets if triangle breaks to the upside.
Targets below the structure are bearish targets if this breaks to the downside.
Price has broken bottom trendline of the triangle and recovered using a prior gap as support.
Doji candle on Friday/indecision.
Short percent is 1.23% approximate and ratio is 2.9.
Earnings can make going long or short tricky so I will wait and see what happens. Longer term I feel this is a short due to the rising wedge. You may see this chart differently than I do.
No recommendation.
There is an old bearish rising wedge ( LOOK LEFT) in this chart just below $40. This pattern has not been validated. This pattern is not valid until the bottom trendline is broken. If history repeats itself, this rising wedge will eventually be broken.
免責事項
この情報および投稿は、TradingViewが提供または推奨する金融、投資、トレード、その他のアドバイスや推奨を意図するものではなく、それらを構成するものでもありません。詳細は利用規約をご覧ください。
免責事項
この情報および投稿は、TradingViewが提供または推奨する金融、投資、トレード、その他のアドバイスや推奨を意図するものではなく、それらを構成するものでもありません。詳細は利用規約をご覧ください。