Intraday Technical Outlook (15m Chart)
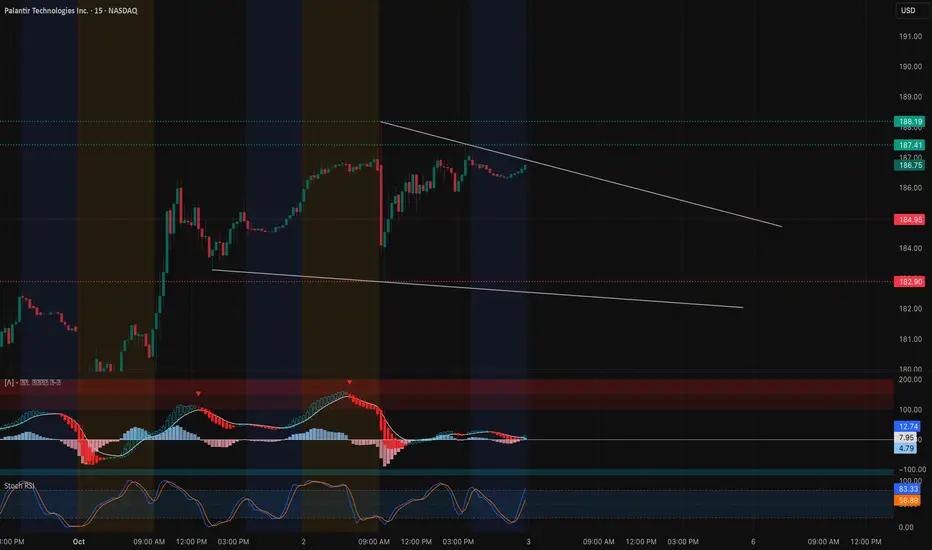
Palantir (PLTR) closed at $186.75, consolidating under a descending trendline after a strong run earlier this week. On the 15-minute chart, price is tightening into a wedge formation:
* MACD: Flattening near neutral after recent downside momentum, showing signs of a potential shift.
* Stoch RSI: Just bounced from mid-zone toward overbought, suggesting near-term strength if momentum holds.
* Key Levels: Resistance sits at $187.4–188.2, followed by $189.4. Support is at $185, with deeper downside near $183–182.9.
Intraday takeaway: PLTR needs to break above $188.2 for a clean breakout; otherwise, the wedge could force a pullback to $185.
Options Sentiment & GEX Outlook (1H Chart)

The GEX map highlights where institutional positioning could steer price action:
* Gamma Walls:
* $188–192.5: Heavy call wall cluster and highest positive GEX — major resistance zone.
* $185–182.5: Key support layers where dealer hedging may slow selling.
* $175 / $170: Large put walls that would act as magnets if downside momentum accelerates.
* Implications:
* Sustaining above $186.5–187 keeps price pinned toward the $188–190 gamma resistance zone.
* A rejection below $185 increases the risk of a pullback toward $182.5–180 before buyers reload.
* Volatility Context: IVR at 26 vs IVx avg 59.2 means premiums are slightly underpriced. With GEX tightly packed, directional breakouts could deliver outsized option moves.
My Thoughts & Recommendation
For Oct 3 trading, PLTR is sitting right at the breakout test:
* Intraday (scalping/trading): Bullish above $187.4 with targets at $188.2–189.5. Failure to break $188 risks fading back toward $185–183.
* Options trading (swing/0DTE): Calls make sense on confirmed breakout above $188, chasing toward $190–192. Puts become favorable if PLTR rejects $188 and slips back under $185, with $182.5 as the first magnet.
Bias heading into Oct 3: Bullish leaning, but only if $188 breaks cleanly.
Disclaimer: This analysis is for educational purposes only and does not constitute financial advice. Always do your own research and manage risk before trading.
Palantir (PLTR) closed at $186.75, consolidating under a descending trendline after a strong run earlier this week. On the 15-minute chart, price is tightening into a wedge formation:
* MACD: Flattening near neutral after recent downside momentum, showing signs of a potential shift.
* Stoch RSI: Just bounced from mid-zone toward overbought, suggesting near-term strength if momentum holds.
* Key Levels: Resistance sits at $187.4–188.2, followed by $189.4. Support is at $185, with deeper downside near $183–182.9.
Intraday takeaway: PLTR needs to break above $188.2 for a clean breakout; otherwise, the wedge could force a pullback to $185.
Options Sentiment & GEX Outlook (1H Chart)
The GEX map highlights where institutional positioning could steer price action:
* Gamma Walls:
* $188–192.5: Heavy call wall cluster and highest positive GEX — major resistance zone.
* $185–182.5: Key support layers where dealer hedging may slow selling.
* $175 / $170: Large put walls that would act as magnets if downside momentum accelerates.
* Implications:
* Sustaining above $186.5–187 keeps price pinned toward the $188–190 gamma resistance zone.
* A rejection below $185 increases the risk of a pullback toward $182.5–180 before buyers reload.
* Volatility Context: IVR at 26 vs IVx avg 59.2 means premiums are slightly underpriced. With GEX tightly packed, directional breakouts could deliver outsized option moves.
My Thoughts & Recommendation
For Oct 3 trading, PLTR is sitting right at the breakout test:
* Intraday (scalping/trading): Bullish above $187.4 with targets at $188.2–189.5. Failure to break $188 risks fading back toward $185–183.
* Options trading (swing/0DTE): Calls make sense on confirmed breakout above $188, chasing toward $190–192. Puts become favorable if PLTR rejects $188 and slips back under $185, with $182.5 as the first magnet.
Bias heading into Oct 3: Bullish leaning, but only if $188 breaks cleanly.
Disclaimer: This analysis is for educational purposes only and does not constitute financial advice. Always do your own research and manage risk before trading.
免責事項
これらの情報および投稿は、TradingViewが提供または保証する金融、投資、取引、またはその他の種類のアドバイスや推奨を意図したものではなく、またそのようなものでもありません。詳しくは利用規約をご覧ください。
免責事項
これらの情報および投稿は、TradingViewが提供または保証する金融、投資、取引、またはその他の種類のアドバイスや推奨を意図したものではなく、またそのようなものでもありません。詳しくは利用規約をご覧ください。