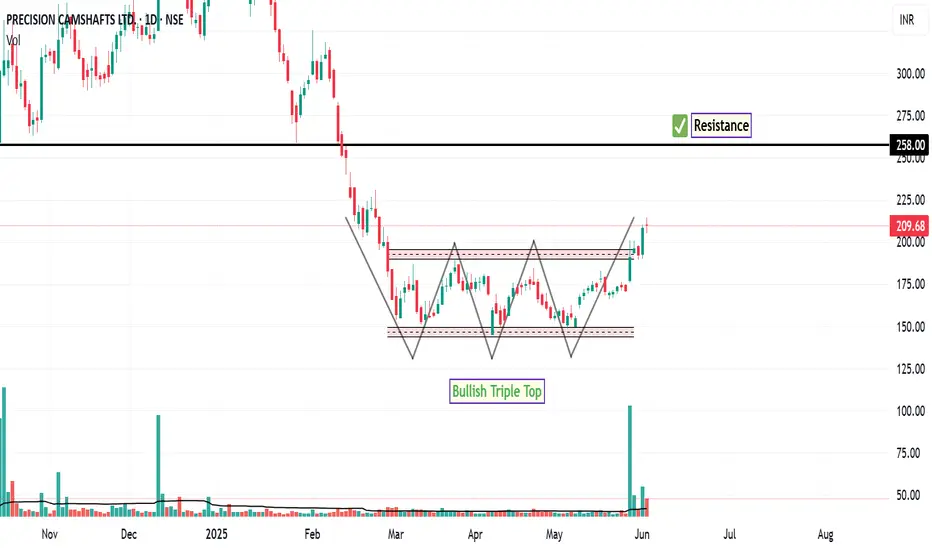
The daily chart of PRECAM is currently displaying a technically constructive setup. Notably, the price structure resembles a bullish triple top formation, which, in this context, appears to be acting as a continuation pattern rather than a reversal. This is further supported by a breakout above the recent consolidation range.
Importantly, this breakout has been accompanied by a noticeable increase in trading volume over the past five sessions, which may suggest growing market participation and interest in the stock at current levels.
Key technical indicators are aligned with this bullish momentum:
RSI is trading above the 70 mark, indicating strong upward momentum.
MACD is positioned above the zero line, with the signal line maintaining a positive crossover.
MACD Histogram remains in positive territory, reinforcing the prevailing bullish sentiment.
Based on this setup, the next potential area of price interest or resistance could emerge near the ₹258 level. On the downside, the immediate support lies just below the prior consolidation zone near ₹145. A sustained move below this level could act as a technical invalidation point for short-term bullish setups and may prompt risk management actions.
Disclaimer:
This analysis is intended solely for informational and educational purposes. It does not constitute investment advice, a recommendation, or an offer to buy or sell any financial instrument. All investments carry risk, and past performance is not indicative of future results. Individuals should conduct their own due diligence or consult with a qualified financial advisor before making any investment decisions.
トレード終了: 利益確定目標に到達
Reached at Resistance. Idea Closed免責事項
これらの情報および投稿は、TradingViewが提供または保証する金融、投資、取引、またはその他の種類のアドバイスや推奨を意図したものではなく、またそのようなものでもありません。詳しくは利用規約をご覧ください。
免責事項
これらの情報および投稿は、TradingViewが提供または保証する金融、投資、取引、またはその他の種類のアドバイスや推奨を意図したものではなく、またそのようなものでもありません。詳しくは利用規約をご覧ください。