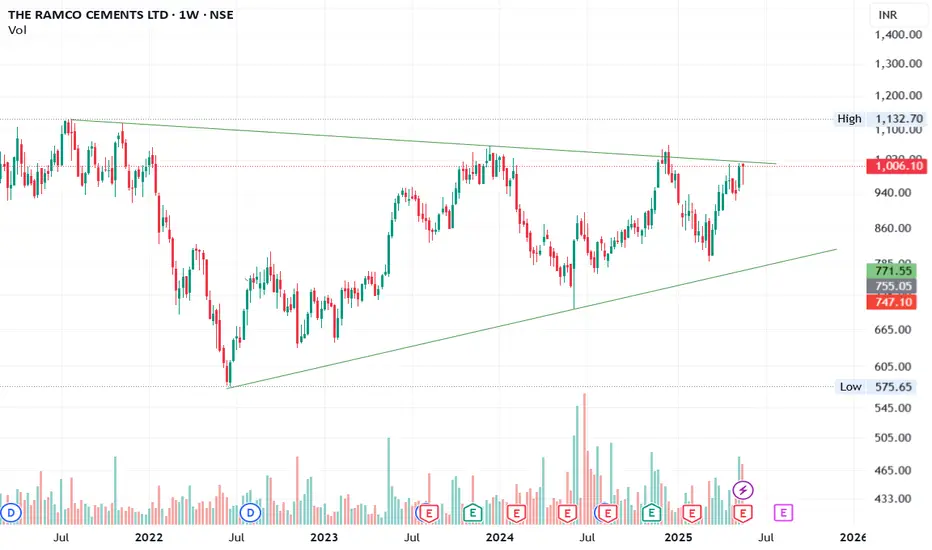
📌 Chart: Weekly | Symbol: NSE:RAMCOCEM
Ramco Cements is testing the upper resistance of a multi-year symmetrical triangle that has been forming since mid-2021. This type of consolidation often precedes a major breakout or breakdown, and we’re now at a critical decision point.
💡 Key Observations:
Price is coiling near the triangle apex — a breakout above ₹1,020 could lead to a strong momentum move.
Multiple attempts to break the upper trendline show building pressure.
Volume has started to pick up on green candles — early signs of accumulation?
Weekly RSI trending higher, signaling strength.
📈 Levels to Watch:
Breakout Zone: ₹1,010–₹1,020
Target Zones: ₹1,150 → ₹1,250+ (if breakout sustains)
Support: ₹930 (short-term), ₹870 (pattern base)
🧠 Bias: Bullish on breakout confirmation
⏳ Strategy: Wait for a close above ₹1,020 with volume. Keep SL below last swing low.
免責事項
これらの情報および投稿は、TradingViewが提供または保証する金融、投資、取引、またはその他の種類のアドバイスや推奨を意図したものではなく、またそのようなものでもありません。詳しくは利用規約をご覧ください。
免責事項
これらの情報および投稿は、TradingViewが提供または保証する金融、投資、取引、またはその他の種類のアドバイスや推奨を意図したものではなく、またそのようなものでもありません。詳しくは利用規約をご覧ください。