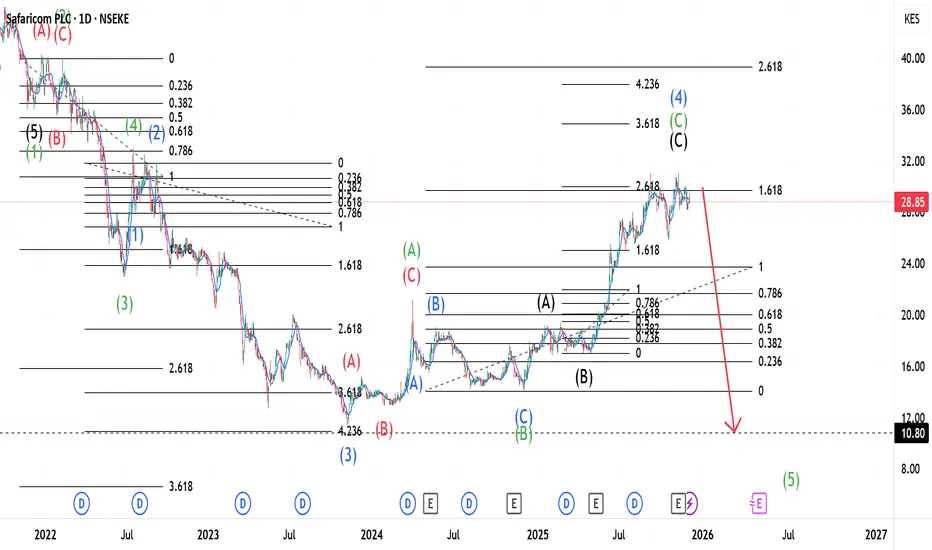
Looking at an all time Safaricom chart, we reach a Flat correction(A,B and C), and whole chart represents the C part of the correction as mentioned. Our Wave C is full of character showcasing 5 internal waves as expected.
We start off with Wave 1(Green), from the top left of the chart, that had 5 internal waves shown in black. When Wave 1 was completed, we witnessed a Flat correction with 3 internal waves, A, B and C. These 3 formed our Wave 2(Green) and we should expect a Zigzag correction for Wave 4(Green). Wave 3(Green) respects the 1.618 Fib. level then forms Wave 4(Green). Indeed Wave 4 was a Zigzag as expected and then Wave 5(Green) proceeded.
Wave 5 shows character also, with 5 internal waves all shown in Blue. When Wave 1(Blue) completed, Wave 2 expressed itself in a Flat correction and we should expect a Zigzag for Wave 4(Blue). Wave 3 is long and almost gets to the 4.236 Fib. level. As expected, our Wave 4 was a Zigzag(specifically a double Zigzag) that retraces and confirms at the 2.618 and 1.618 Fib. levels. We should expect a Wave 5(Blue) to the region of 4.236 Fib. level which is around Ksh 10.80.
免責事項
この情報および投稿は、TradingViewが提供または推奨する金融、投資、トレード、その他のアドバイスや推奨を意図するものではなく、それらを構成するものでもありません。詳細は利用規約をご覧ください。
免責事項
この情報および投稿は、TradingViewが提供または推奨する金融、投資、トレード、その他のアドバイスや推奨を意図するものではなく、それらを構成するものでもありません。詳細は利用規約をご覧ください。