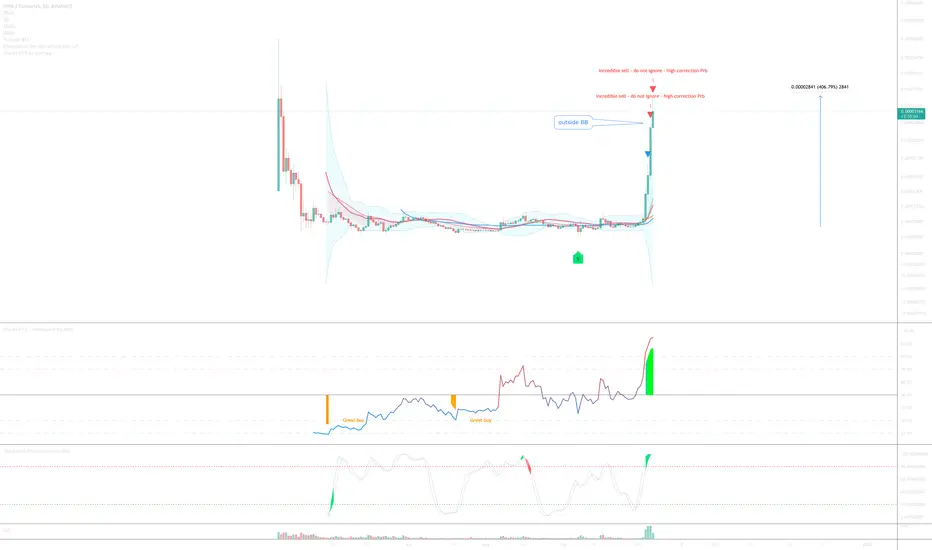
400% in 6-days. Crazy. There is now a ‘incredible sell’ alert on the above 1-day dollar chart and a ‘great sell’ alert on the 1-day BTC chart (below). The purpose of this alert is not to say the market top is in but rather the probability of further upside is now <10%. Is that a risk you want to take with your 400% gain?
Additionally price action is way outside the Bollinger Band. 95% of all candles are inside the band. Don’t let emotions tell you otherwise ;)
A sell from 3400 is amazing, but 90% risky.
1st support test is around 2300 or 30% below.
Good luck!
WW
1-day SHIB / BTC

Additionally price action is way outside the Bollinger Band. 95% of all candles are inside the band. Don’t let emotions tell you otherwise ;)
A sell from 3400 is amazing, but 90% risky.
1st support test is around 2300 or 30% below.
Good luck!
WW
1-day SHIB / BTC
トレード稼働中
ノート
Someone asks, is it safe to now go long? My answer: 100% no. The sell signal was confirmed, the probability of continued downside remains high, at least until 2400.
トレード稼働中
Be careful, price action is @ resistance, just as it was twice before. While it may seem like price action is making great gains the facts are it is only up 25% compared with a 400% gain beforehand at the 'incredible sell' signal.Don't be the whales exit liquidity.
ノート
PS: if you feel like you missed out, I'll post an update shortly to a new meme token that mimics all the TA just before SHIBA INU took off. Keep your eyes peeled.トレード稼働中
Price action has now doubled since this idea was published. A 2x following the previous 4x. These crazy moves are enough to put you off TA! The chart below is the daily without candles but only the Bollinger Band. The red line is where price action is currently.
95% of all price action is within the Bollinger Band, i.e. 2 standard deviations from the mean. It is very clear to see here price action is well outside the band. Expect a snap back to the mean,
トレード稼働中
RSI double topped as price action shot up another 150%. Amazing.Stochastic RSI now drops below 20 (purple circle), look left for reasons why you should not ignore this (on any 1-day chart for that matter).
If you still want to go long then watch for Stochastic RSI crossing back up 20. No longs until that happens.
ノート
Continues to look very bearish overall. Might see a run to recent top but I certainly would not be going long, exit opportunities only.免責事項
これらの情報および投稿は、TradingViewが提供または保証する金融、投資、取引、またはその他の種類のアドバイスや推奨を意図したものではなく、またそのようなものでもありません。詳しくは利用規約をご覧ください。
免責事項
これらの情報および投稿は、TradingViewが提供または保証する金融、投資、取引、またはその他の種類のアドバイスや推奨を意図したものではなく、またそのようなものでもありません。詳しくは利用規約をご覧ください。