📈Technical Analysis
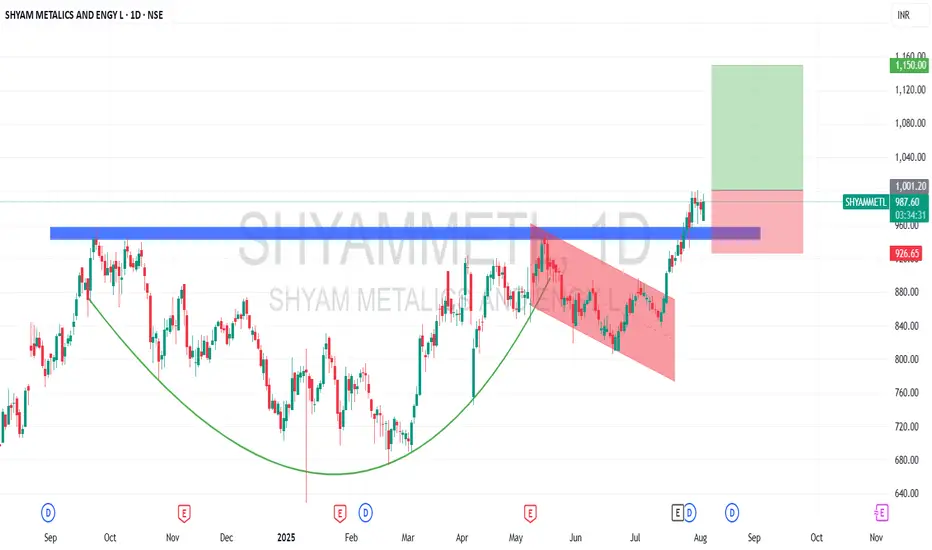
The stock listed in 2021 and was in a downtrend until 2023. From ₹250, it rallied to reach ₹950 in September 2024, forming its all-time high. Since then, the ₹950 zone acted as resistance multiple times, during which a Cup & Handle pattern emerged.
This week, the stock decisively broke that resistance on the back of positive Q1 FY26 results. Trading around ₹978 now, it gained momentum.
Take position only once the stock crosses ₹1,000, targeting:
🎯₹1,050 (Target 1)
🎯₹1,100 (Target 2)
🎯₹1,150 (Target 3)
Keep your stop loss at ₹930. A breach below that invalidates the bullish pattern.
💰Q1 FY26 Financial Highlights (vs Q4 FY25 & Q1 FY25)
- Total Income: ₹4,419 Cr (↑ +6.8% QoQ vs ₹4,139 Cr; ↑ +22.4% YoY vs ₹3,612 Cr)
- Total Expenses: ₹3,839 Cr (↑ +5.6% QoQ vs ₹3,624 Cr; ↑ +22.9% YoY vs ₹3,124 Cr)
- Operating Profits (EBITDA): ₹580 Cr (↑ +12.5% QoQ vs ₹515 Cr; ↑ +18.8% YoY vs ₹488 Cr)
- Profit Before Tax: ₹389 Cr (↑ +31% QoQ vs ₹297 Cr; ↑ +4% YoY vs ₹374 Cr)
- Profit After Tax: ₹291 Cr (↑ +32% QoQ vs ₹220 Cr; ↑ +6% YoY vs ₹276 Cr)
- Diluted EPS: ₹10.47 (↑ QoQ vs ₹7.84; ↑ YoY vs ₹9.89)
🧠Fundamentals & Dividend Insights
Q1 PAT rose 33.6% QoQ to ₹292 Cr, led by improved margins and revenue growth (Revenue ₹4,419 Cr)
EBITDA margin expanded to 13.1% (vs 12.4% QoQ), reflecting cost efficiencies
Management approved fundraising up to ₹4,500 Cr via equity/debt/NCDs, indicating growth capital in pipeline
Interim dividend announced of ₹1.80/share for FY26 — shareholders rewarded amid momentum
Low debt (Debt/Equity ~0.07), strong ROCE (~12%), and high asset turnover reflect financial discipline
✅Summary
Shyam Metalics has displayed a textbook breakout from a notable resistance zone, confirmed by strong Q1 fundamentals and margin expansion. Key inputs:
💵 Revenue up 22% YoY; PAT up 33% QoQ
➕ Fresh strength above ₹950 resistance
🎯 Clear upside targets: ₹1,050 → ₹1,100 → ₹1,150
⚠️ Strict stop-loss level: ₹930
Disclaimer:lnkd.in/gJJDnvn2
免責事項
これらの情報および投稿は、TradingViewが提供または保証する金融、投資、取引、またはその他の種類のアドバイスや推奨を意図したものではなく、またそのようなものでもありません。詳しくは利用規約をご覧ください。
免責事項
これらの情報および投稿は、TradingViewが提供または保証する金融、投資、取引、またはその他の種類のアドバイスや推奨を意図したものではなく、またそのようなものでもありません。詳しくは利用規約をご覧ください。