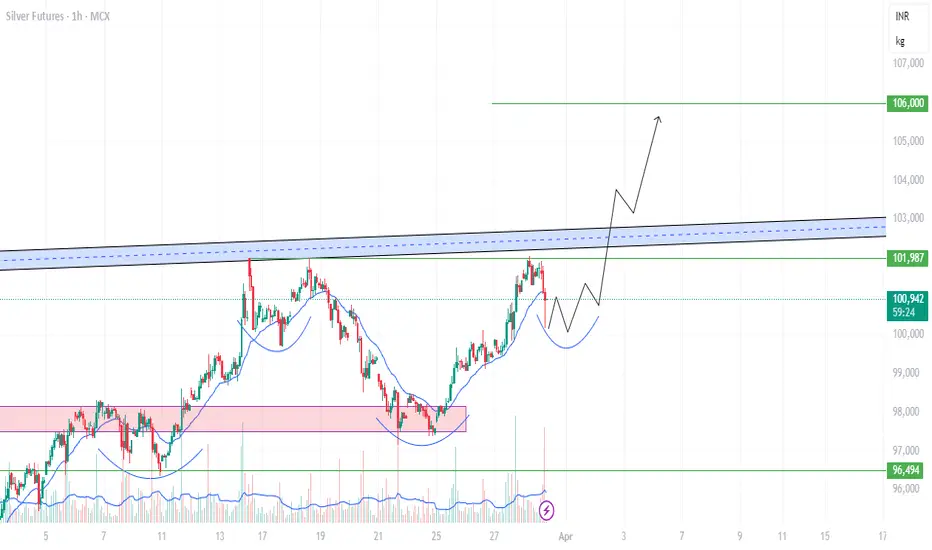
chart shows an Inverse Head and Shoulders pattern in Silver Futures on the 1-hour timeframe.
The neckline (resistance) is marked by the blue zone, which, if broken with strong volume, could confirm a bullish breakout. The projected price movement (black arrow) suggests a potential rally toward ₹106,000.
A confirmation would come if the price breaks above the ₹101,987 - ₹103,000 resistance zone with volume.
Place SL below the right shoulder (~₹100,000) for a safe trade.
免責事項
これらの情報および投稿は、TradingViewが提供または保証する金融、投資、取引、またはその他の種類のアドバイスや推奨を意図したものではなく、またそのようなものでもありません。詳しくは利用規約をご覧ください。
免責事項
これらの情報および投稿は、TradingViewが提供または保証する金融、投資、取引、またはその他の種類のアドバイスや推奨を意図したものではなく、またそのようなものでもありません。詳しくは利用規約をご覧ください。