SMC Global Securities – Breakout Build-up with Volume Expansion
 SMCGLOBAL
📈Pattern & Setup:
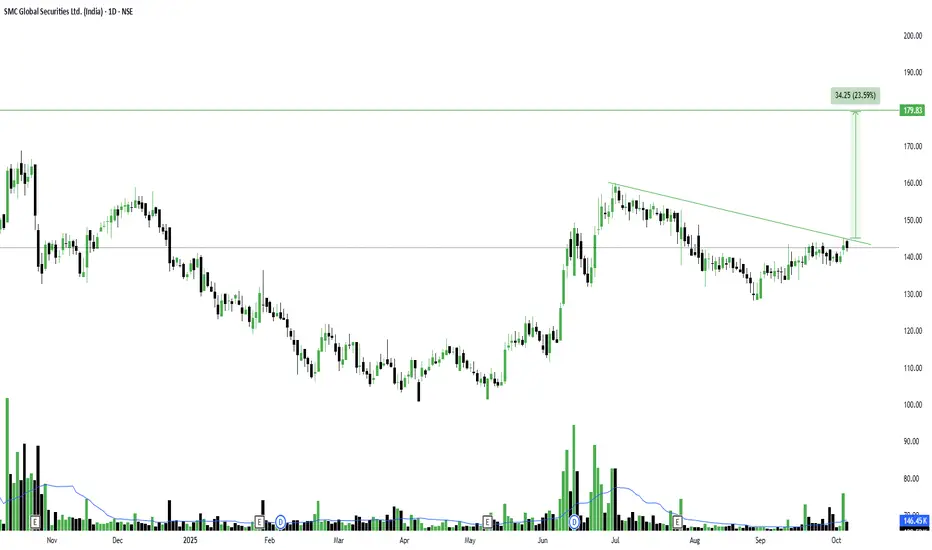
SMC Global Securities is currently showing a descending trendline breakout pattern on the daily chart. After months of sideways consolidation, the stock has started moving up with steady buying volume near the trendline resistance.
The structure resembles a falling channel breakout in progress, which usually indicates a trend reversal from down to up. Volume has recently picked up — a positive sign that accumulation might be underway.
If the stock manages a close above 147–150, it could trigger a quick rally toward 170–180 zones. The breakout zone aligns well with previous supply, making it an important level to watch.
📝 Trade Plan:
Entry: Above 148–150 with strong volume confirmation.
🚩Stop-Loss: 138 (below near-term support).
🎯Targets:
Target 1 → 165 (short-term resistance).
Target 2 → 180 (measured move target, ~23% upside).
💡Pyramiding Strategy:
1. Enter initial 50% position above 148 breakout.
2. Add the remaining once price sustains above 155.
3. Trail stop-loss to 145 once price crosses 160.
🧠Logic Behind Selecting this Trade:
The stock has shown steady recovery from its base with multiple higher lows, signaling strength returning. The descending trendline has acted as a cap for months — a breakout here with volume can open the door for a fresh short-term uptrend.
Keep Learning. Keep Earning.
Let’s grow together 📚🎯
🔴Disclaimer:
This analysis is for educational purposes only. Not a buy/sell recommendation. Please consult your financial advisor before making any investment or trading decisions.
📈Pattern & Setup:
SMC Global Securities is currently showing a descending trendline breakout pattern on the daily chart. After months of sideways consolidation, the stock has started moving up with steady buying volume near the trendline resistance.
The structure resembles a falling channel breakout in progress, which usually indicates a trend reversal from down to up. Volume has recently picked up — a positive sign that accumulation might be underway.
If the stock manages a close above 147–150, it could trigger a quick rally toward 170–180 zones. The breakout zone aligns well with previous supply, making it an important level to watch.
📝 Trade Plan:
Entry: Above 148–150 with strong volume confirmation.
🚩Stop-Loss: 138 (below near-term support).
🎯Targets:
Target 1 → 165 (short-term resistance).
Target 2 → 180 (measured move target, ~23% upside).
💡Pyramiding Strategy:
1. Enter initial 50% position above 148 breakout.
2. Add the remaining once price sustains above 155.
3. Trail stop-loss to 145 once price crosses 160.
🧠Logic Behind Selecting this Trade:
The stock has shown steady recovery from its base with multiple higher lows, signaling strength returning. The descending trendline has acted as a cap for months — a breakout here with volume can open the door for a fresh short-term uptrend.
Keep Learning. Keep Earning.
Let’s grow together 📚🎯
🔴Disclaimer:
This analysis is for educational purposes only. Not a buy/sell recommendation. Please consult your financial advisor before making any investment or trading decisions.
TrendX INC
関連の投稿
免責事項
この情報および投稿は、TradingViewが提供または推奨する金融、投資、トレード、その他のアドバイスや推奨を意図するものではなく、それらを構成するものでもありません。詳細は利用規約をご覧ください。
TrendX INC
関連の投稿
免責事項
この情報および投稿は、TradingViewが提供または推奨する金融、投資、トレード、その他のアドバイスや推奨を意図するものではなく、それらを構成するものでもありません。詳細は利用規約をご覧ください。