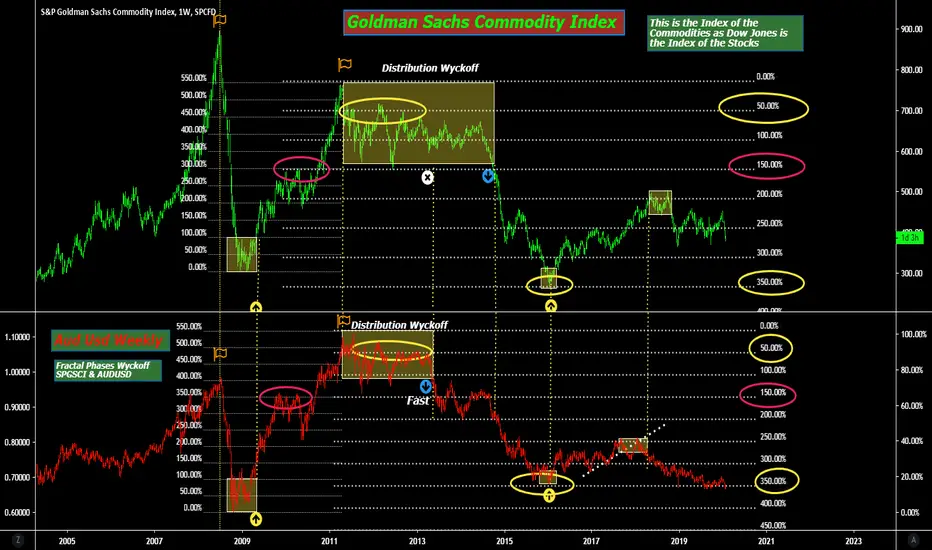
350 % - 550% very important for the grid for trend short is the 0 ( extreme high) - 150 ( last relative top before extreme high ) 50 ( pull back later estreme high ) , the 350 descending is 1° first very obstacle for trend short ( or trend long , a great trend is 2 movement 0-350 and 350- 550 ( can you see that in dow jones 1900 -2020 , bottom is 1932 , 1965 -1966 is 350% now we are in 550% !!!!! ) , if it exceeds 350% ( 7 times the base of Gann ) the bottom ( or the top ) is under 350% , the bottom , the end of trend short of the great distribution, is zone 550% .
免責事項
この情報および投稿は、TradingViewが提供または推奨する金融、投資、トレード、その他のアドバイスや推奨を意図するものではなく、それらを構成するものでもありません。詳細は利用規約をご覧ください。
免責事項
この情報および投稿は、TradingViewが提供または推奨する金融、投資、トレード、その他のアドバイスや推奨を意図するものではなく、それらを構成するものでもありません。詳細は利用規約をご覧ください。