There are no perfect market indicators. However, traders can increase the chances of success by using two indicators in conjunction.
For the S&P 500 (SPX) combining the Relative Strength Index (RSI) with the Commodity Channel Index (CCI) could be helpful in discovering turns.
Momentum divergences frequently hint of a potential trend reversal. The RSI is one of the best indicators for divergence on stock indices. But what about the times in which the RSI has no momentum divergence? There could still be an index turn that is missed.
Pairing the CCI with the RSI helps to filter out SPX turns that the RSI may not catch.
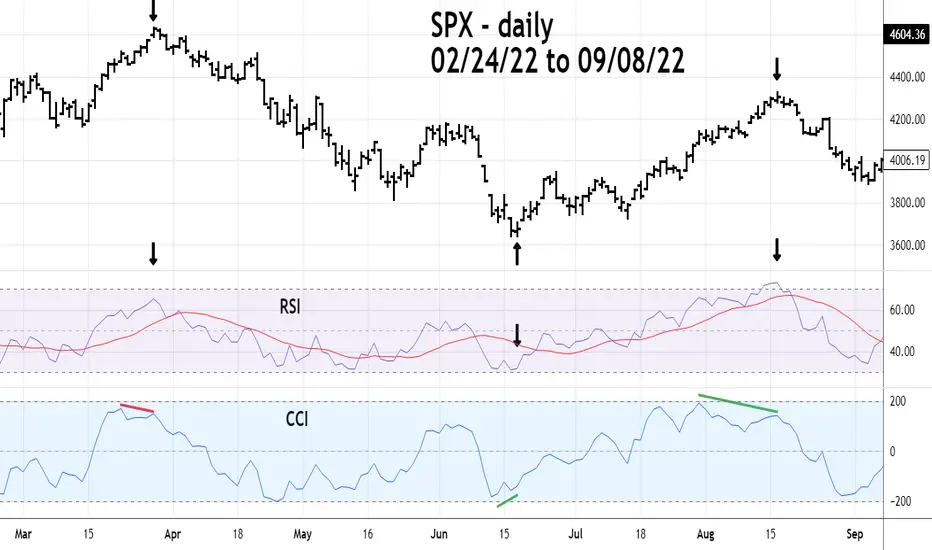
The SPX February to September daily chart shows three examples of when the CCI had divergences while the RSI had none.
Using CCI with RSI on SPX charts could help improve trading and market analysis.
For the S&P 500 (SPX) combining the Relative Strength Index (RSI) with the Commodity Channel Index (CCI) could be helpful in discovering turns.
Momentum divergences frequently hint of a potential trend reversal. The RSI is one of the best indicators for divergence on stock indices. But what about the times in which the RSI has no momentum divergence? There could still be an index turn that is missed.
Pairing the CCI with the RSI helps to filter out SPX turns that the RSI may not catch.
The SPX February to September daily chart shows three examples of when the CCI had divergences while the RSI had none.
Using CCI with RSI on SPX charts could help improve trading and market analysis.
免責事項
これらの情報および投稿は、TradingViewが提供または保証する金融、投資、取引、またはその他の種類のアドバイスや推奨を意図したものではなく、またそのようなものでもありません。詳しくは利用規約をご覧ください。
免責事項
これらの情報および投稿は、TradingViewが提供または保証する金融、投資、取引、またはその他の種類のアドバイスや推奨を意図したものではなく、またそのようなものでもありません。詳しくは利用規約をご覧ください。