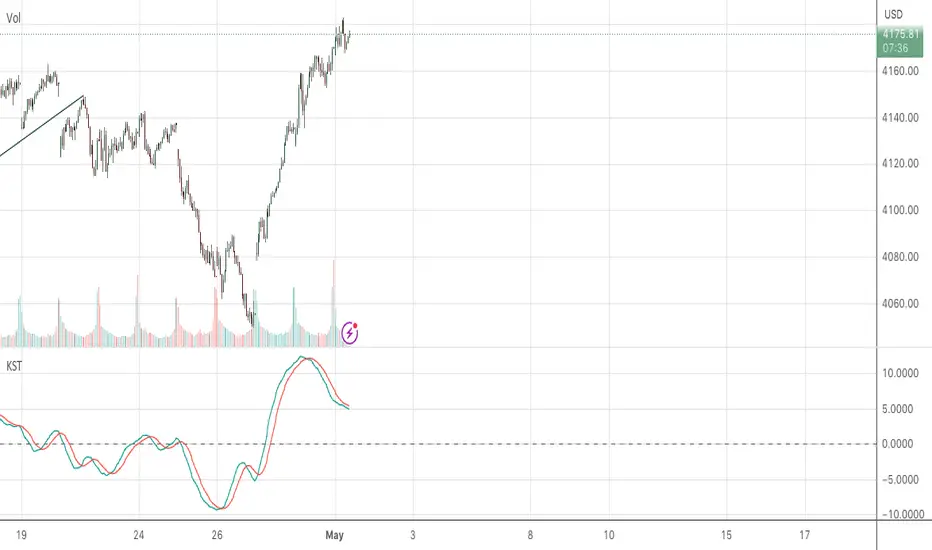
Note the "short term sell signal" rendered this morning
by the KST Indicator on the 15 Minute S+P 500 (Chart Included Here )
Upon looking, you can "see" the KST crossing and then rolling over,
PRIOR to the SPX price peak of 4182.74 this morning.
You had a clue the rally might not last
There was an obvious bearish divergence setting up in the indicator.
Short-Term traders should watch KST closely, especially in 15 Minute Intervals
as moves like this mornings "quick pop and burst " after the NYSE Open
are what makes the KST Indicator so highly respected by traders looking to make money.
SPX NOON OPEN 4174.53
THE_UNWIND
WOODS OF CONNECTICUT
免責事項
これらの情報および投稿は、TradingViewが提供または保証する金融、投資、取引、またはその他の種類のアドバイスや推奨を意図したものではなく、またそのようなものでもありません。詳しくは利用規約をご覧ください。
免責事項
これらの情報および投稿は、TradingViewが提供または保証する金融、投資、取引、またはその他の種類のアドバイスや推奨を意図したものではなく、またそのようなものでもありません。詳しくは利用規約をご覧ください。