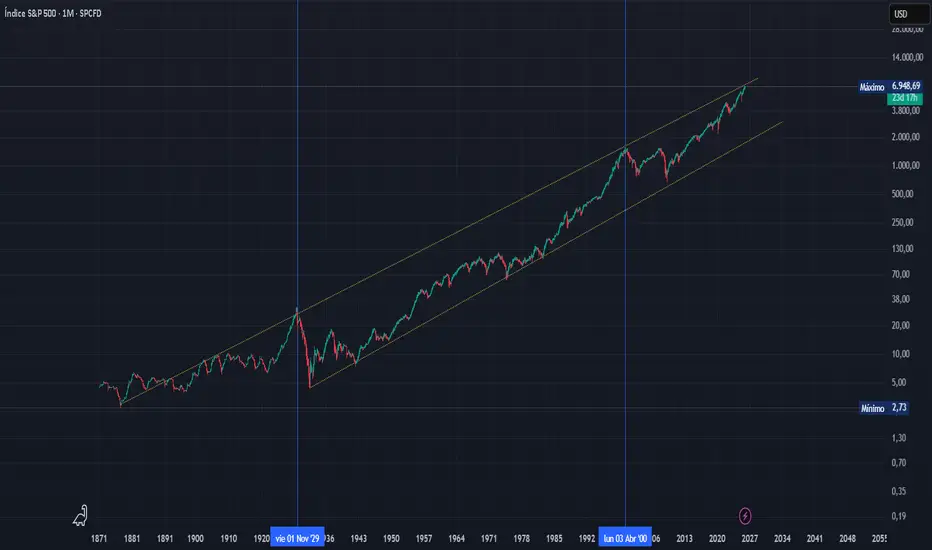
S&P 500 Monthly – Historical Logarithmic Chart –
The S&P 500 is approaching long-term resistance seen in 1929 and 2000.
In log scale, this represents limits to sustained percentage growth, highlighting elevated valuations and potential caution.
Historically, similar levels have led to deep corrections, sideways consolidation, or rare breakouts.
Key takeaway : At this stage, disciplined caution and selective positioning tend to generate better long-term alpha than chasing broad market gains.
免責事項
この情報および投稿は、TradingViewが提供または推奨する金融、投資、トレード、その他のアドバイスや推奨を意図するものではなく、それらを構成するものでもありません。詳細は利用規約をご覧ください。
免責事項
この情報および投稿は、TradingViewが提供または推奨する金融、投資、トレード、その他のアドバイスや推奨を意図するものではなく、それらを構成するものでもありません。詳細は利用規約をご覧ください。